- analyse an infrared spectrum of a simple molecule to identify functional groups (see the Data section for the functional groups required)
Analytical techniques
A-Level Chemistry · Topic 22
 8:45
8:45
Analytical techniques (AS)
You have just made a new compound. It is a clear liquid in a flask, with no label, and you cannot see a single molecule. How do you prove what it is? You ask…
English narration · English + 中文 subtitles burned in
22.1
Infrared spectroscopy

Syllabus
Source: Cambridge International syllabus
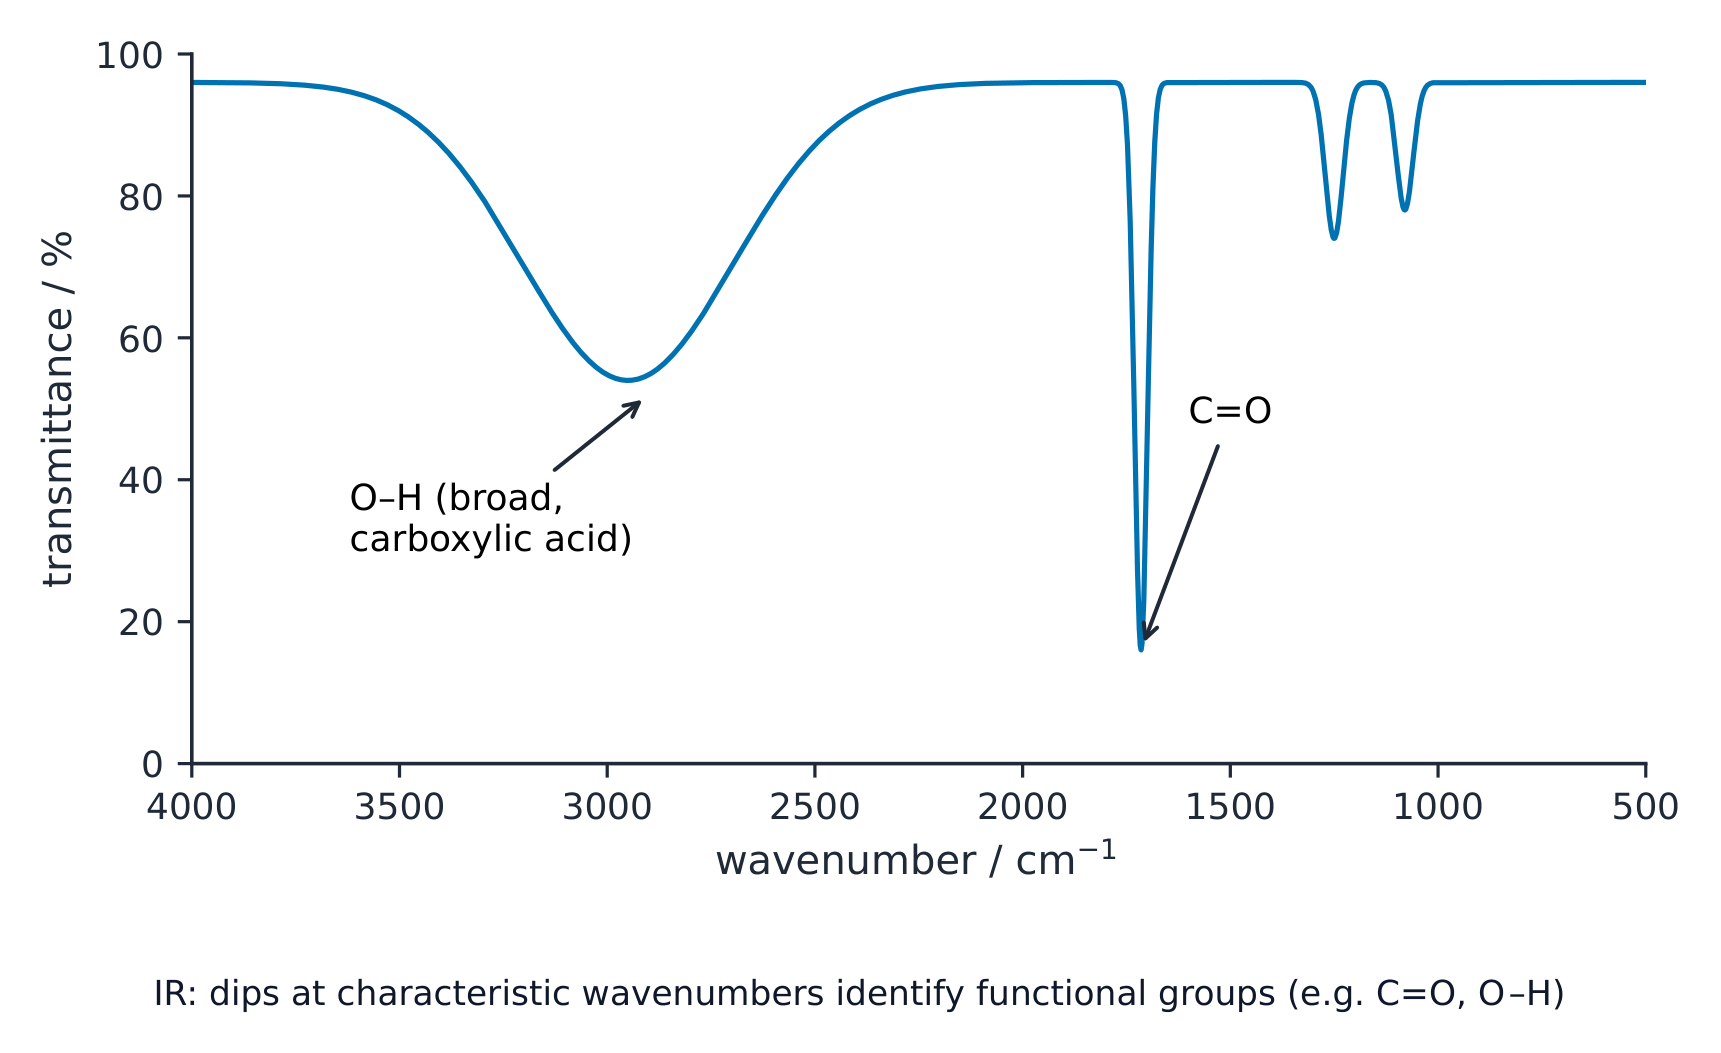
Infrared spectroscopy 红外光谱 helps you find the functional group 官能团 in a molecule. Each kind of bond soaks up (absorbs) infrared radiation at its own range of frequencies. Where the bond shows strong absorption 吸收, the spectrum has a dip.
The position is measured in wavenumber 波数 (in $\text{cm}^{-1}$). You are given a data table, so you do not memorise the numbers. You just match the dips to bonds:
- a broad dip around $3200$–$3650\ \text{cm}^{-1}$ → an O–H bond in an alcohol.
- a dip around $1700\ \text{cm}^{-1}$ → a C=O bond (aldehyde, ketone, acid or ester).
- a broad dip $2500$–$3000\ \text{cm}^{-1}$ together with a C=O dip → a carboxylic acid.
This is useful for checking a reaction. For example, if propene has been turned into propan-2-ol, the C=C dip should be gone and an O–H dip should appear.
Explore
IR spectroscopy lab
Match an absorption to the bond or functional group it reveals.
Vocabulary
Train
| English |
|---|
| infrared spectroscopy/ˌɪnfrəˈred spekˈtrɒskəpi/ |
| functional group/ˈfʌŋkʃənl ɡruːp/ |
| absorption/əbˈsɔːpʃn/ |
| wavenumber/ˈweɪvnʌmbə/ |
22.2
Mass spectrometry

Syllabus
- analyse mass spectra in terms of $m/e$ values and isotopic abundances (knowledge of the working of the mass spectrometer is not required)
- calculate the relative atomic mass of an element given the relative abundances of its isotopes, or its mass spectrum
- deduce the molecular mass of an organic molecule from the molecular ion peak in a mass spectrum
- suggest the identity of molecules formed by simple fragmentation in a given mass spectrum
- deduce the number of carbon atoms, $n$, in a compound using the $[M + 1]^+$ peak and the formula $$n = \frac{100 \times \text{abundance of } [M + 1]^+ \text{ ion}}{1.1 \times \text{abundance of } M^+ \text{ ion}}$$
- deduce the presence of bromine and chlorine atoms in a compound using the $[M + 2]^+$ peak
Source: Cambridge International syllabus
In mass spectrometry 质谱, a molecule is turned into ions and sorted by its mass-to-charge ratio 质荷比 ($m/e$). The spectrum is a set of peaks at different $m/e$ values.
Relative atomic mass from isotopes
An element's isotope 同位素 mixture gives several peaks. From the isotopic abundance 同位素丰度 (how common each isotope is) you can find the relative atomic mass 相对原子质量 — a weighted average:
$$A_r = \frac{\sum (\text{isotope mass} \times \text{abundance})}{\sum \text{abundance}}$$
For example, chlorine is 75% $^{35}\text{Cl}$ and 25% $^{37}\text{Cl}$, giving $A_r = \dfrac{35 \times 75 + 37 \times 25}{100} = 35.5$.
The molecular ion and fragmentation
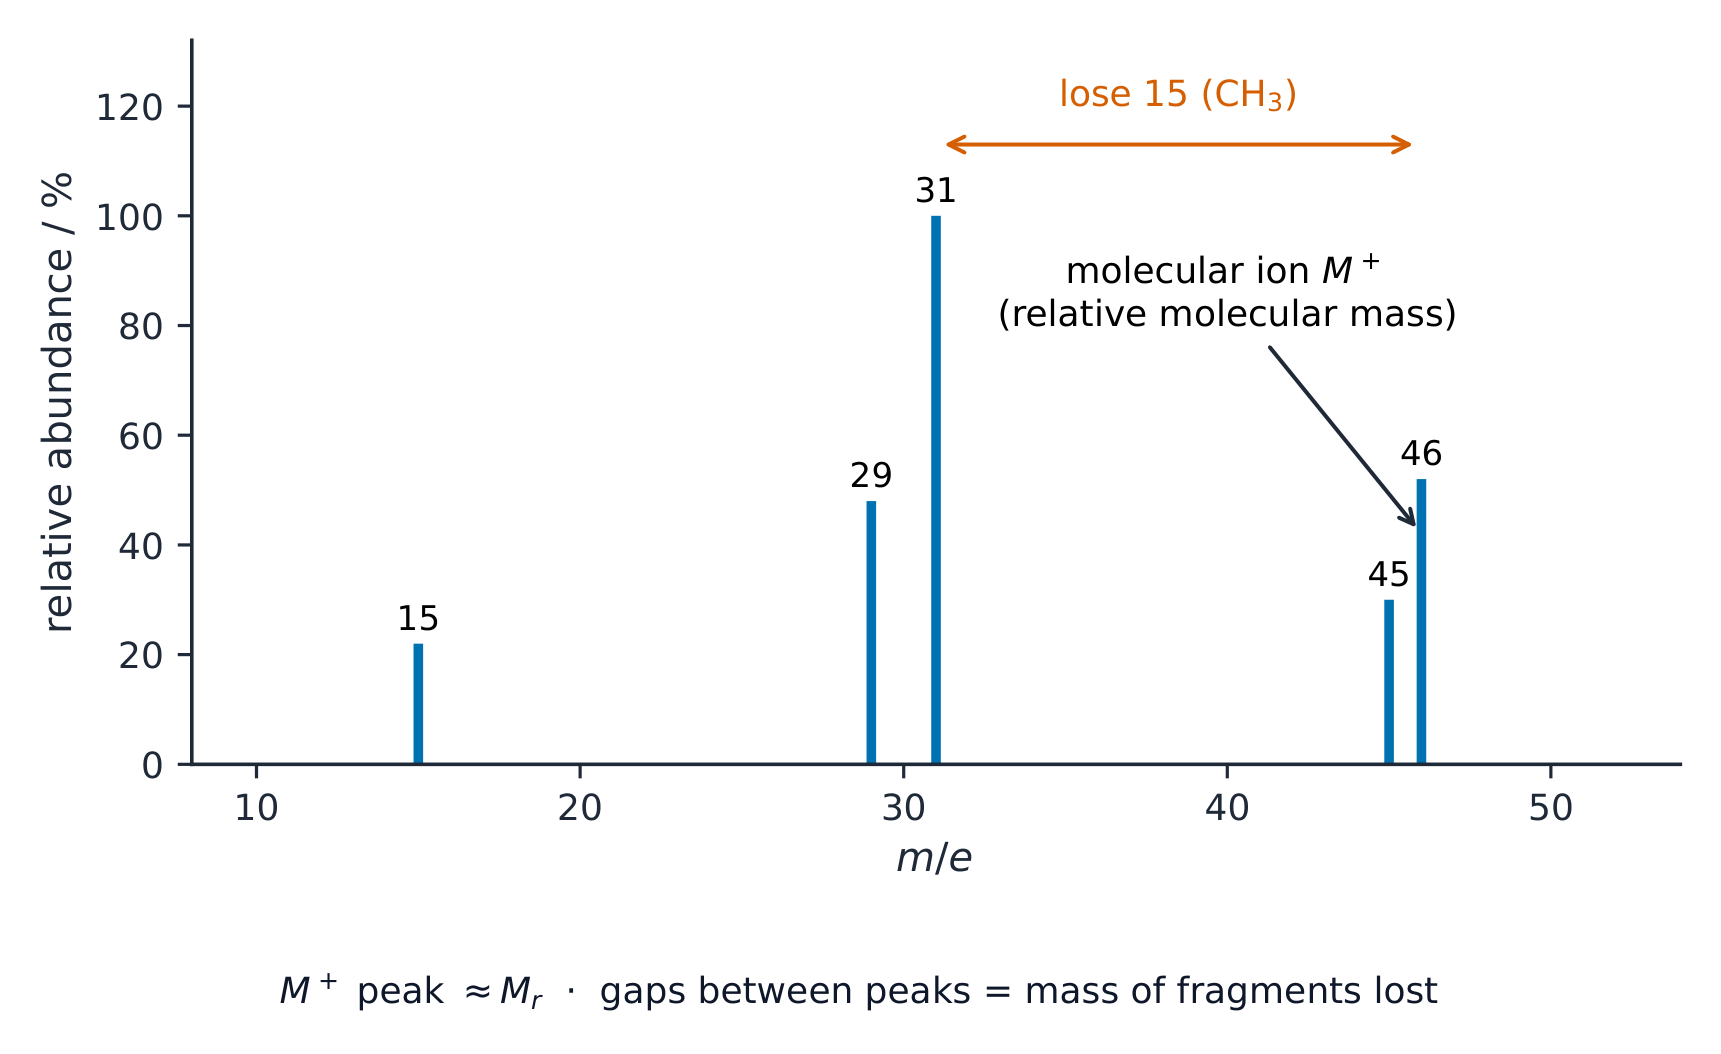
The peak at the highest $m/e$ (the molecular ion 分子离子 peak, or molecular ion peak 分子离子峰, $M^+$) gives the relative molecular mass of the whole molecule.
The molecule also breaks into smaller pieces — this is fragmentation 碎裂. The gap between two peaks tells you the mass of the lost piece, so you can suggest each fragment 碎片. For example, a loss of 15 means a $\text{CH}_3$ group was lost, and a loss of 29 means $\text{CHO}$ or $\text{C}_2\text{H}_5$.
The [M + 1] and [M + 2] peaks
- a small [M + 1] peak comes from the $^{13}\text{C}$ isotope. The number of carbon atoms $n$ is:
$$n = \frac{100 \times \text{abundance of } [M + 1]^+}{1.1 \times \text{abundance of } M^+}$$
- an [M + 2] peak shows chlorine or bromine. One chlorine gives an $[M + 2]$ peak about one third the height of $M^+$ (from $^{37}\text{Cl}$); one bromine gives an $[M + 2]$ peak about the same height as $M^+$ (from $^{81}\text{Br}$).
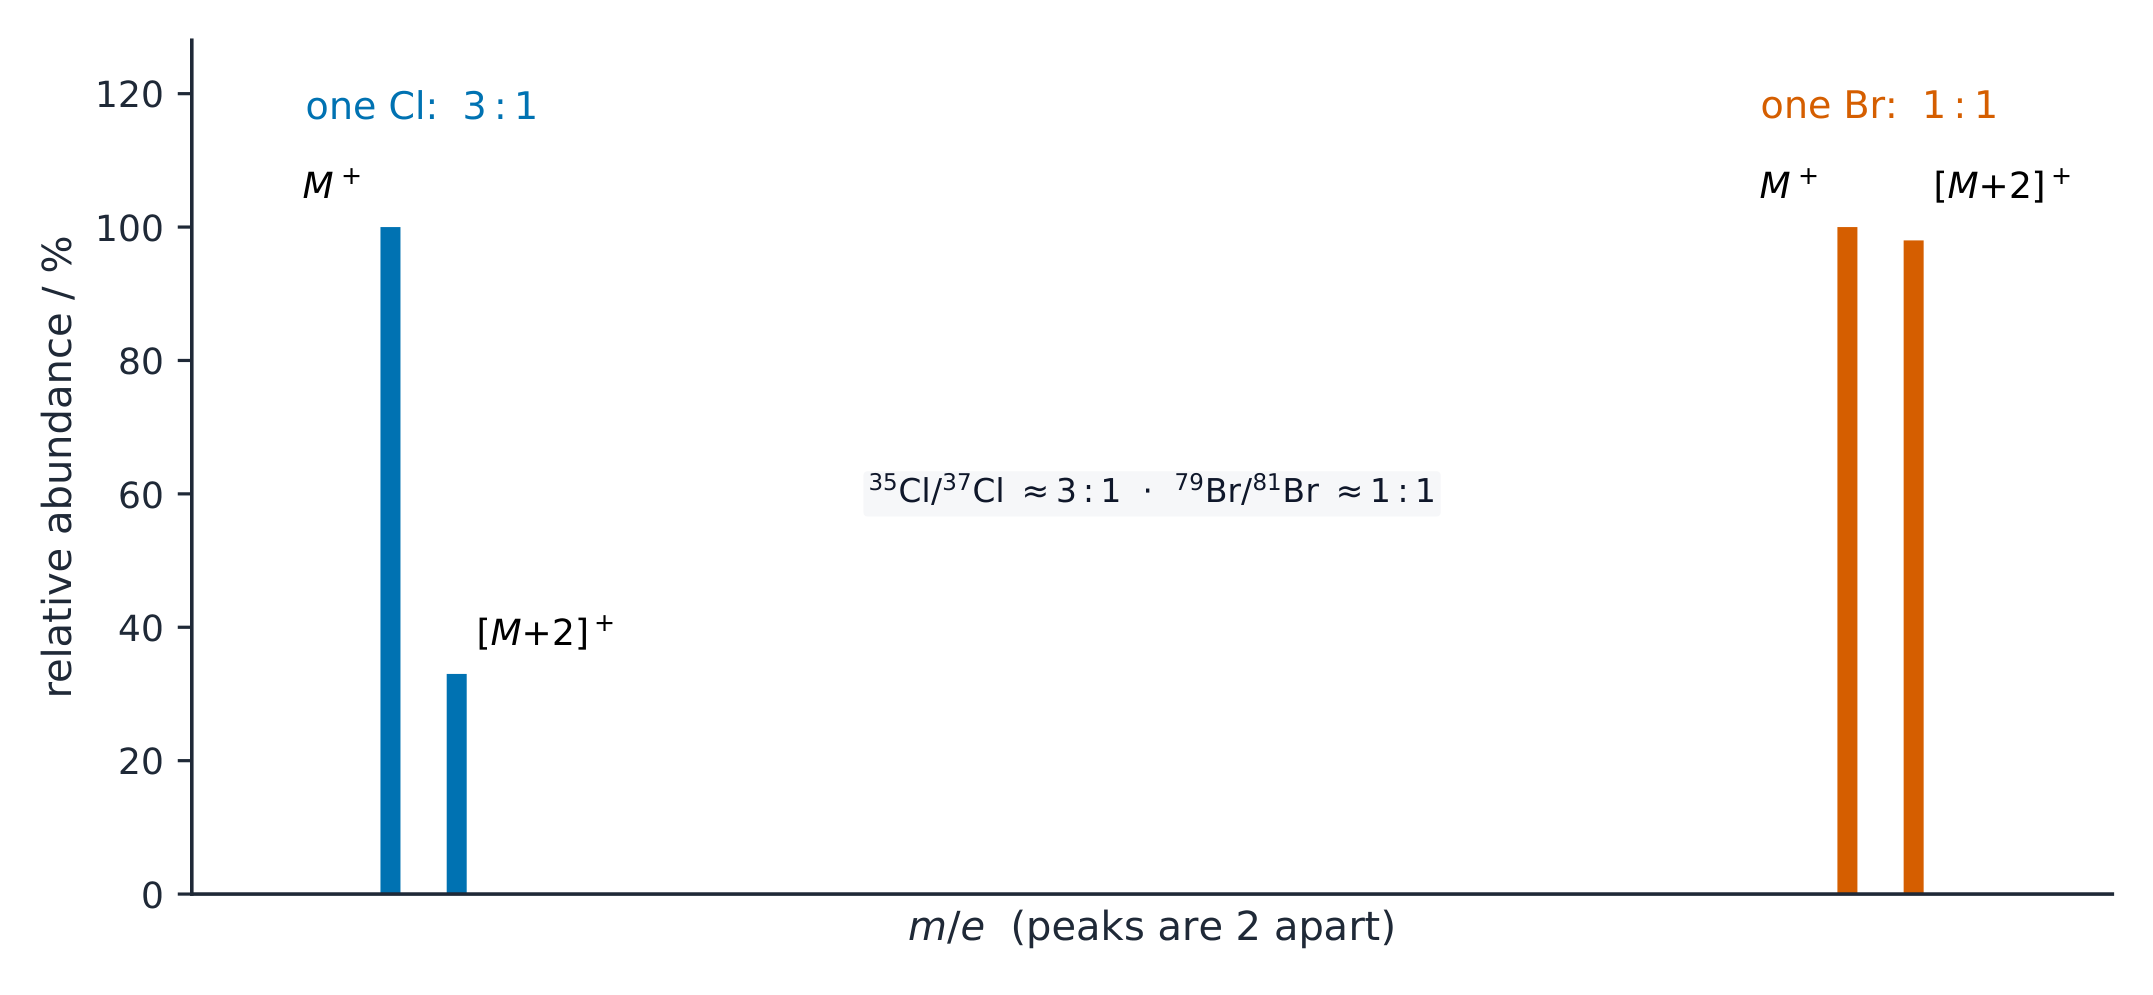
Worked example. A compound shows a molecular ion at $m/e = 108$ and a peak of almost equal height at $m/e = 110$. Its infrared spectrum shows no broad absorption near $3300\ \text{cm}^{-1}$. Deduce its identity. Two peaks two units apart with roughly equal heights are the $1:1$ signature of one bromine atom (from $^{79}\text{Br}$ and $^{81}\text{Br}$); one chlorine would have given a $3:1$ ratio instead. Take the bromine away from the molecular ion: $108 - 79 = 29$, which fits a $\text{C}_2\text{H}_5$ fragment. The absence of a broad peak near $3300\ \text{cm}^{-1}$ rules out an $\text{O-H}$, so there is no alcohol group. The compound is bromoethane, $\text{C}_2\text{H}_5\text{Br}$. Read the $[M+2]$ ratio rather than merely noting the peak: $1:1$ means bromine, $3:1$ means chlorine.
Explore
Mass spectrometry route
Follow a molecule through ionisation, separation and detection.
Vocabulary
Train
| English |
|---|
| mass spectrometry/mæs spekˈtrɒmətri/ |
| mass-to-charge ratio/mæs tə tʃɑːdʒ ˈreɪʃɪəʊ/ |
| isotope/ˈaɪsətəʊp/ |
| isotopic abundance/ˌaɪsəˈtɒpɪk əˈbʌndəns/ |
| relative atomic mass/ˈrelətɪv əˈtɒmɪk mæs/ |
| molecular ion/məˈlekjʊlə ˈaɪɒn/ |
| molecular ion peak/məˈlekjʊlə ˈaɪɒn piːk/ |
| fragmentation/ˌfræɡmənˈteɪʃn/ |
| fragment/ˈfræɡmənt/ |
22.2
Exam tips
- On an IR spectrum quote the wavenumber and the bond (O-H broad $\sim 3200-3600$, C=O $\sim 1700$); use the data booklet.
- The peak at the highest $m/z$ is the molecular ion $\text{M}^+$ and gives the $M_r$.
- Explain fragmentation: the gap between peaks is the lost fragment (loss of 15 = $\text{CH}_3$, 29 = $\text{C}_2\text{H}_5$ or CHO).
- Learn common isotope patterns (Cl gives M and M+2 in about 3:1; M+1 from $^{13}\text{C}$).
Interactive lessons on this topic
Work through it step by step, with instant-check exercises.