היקף ותנאי מקדימים
מסגרת ACT, עדכון פברואר 2026. המקרים בכיתה כאן אינם טופס ACT רשמי.
- קרא מרכז, התפשטות וצורה מנתוני תצוגה מסומנים
- פרש מודל נורמלי באמצעות ממוצע וסטיית תקן
- הבדל בין קשר בין-משתנה לבין ראיות סיבתיות
תנאי קדם: נתונים מסודרים; תדר; ממוצע וחינוך.
הסבר ובחירת השיטה
The mean weights all observations; the median uses their ordered middle. A histogram groups numeric values into intervals, a box plot displays quartiles and a bar chart compares categories. Inspect units, scale and frequencies before comparing apparent width or height. Use the task’s stated quartile convention where calculation is required.
הוספת קבוע משנה את הממוצע והמחצית אך משאירה את סטיית התקן ללא שינוי; כפל הערכים בגורם חיובי מקנה יחסים גם למרכז וגם לפיזור. עבור מודל נורמלי, הממוצע נמצא במרכז הסימטרי; כ-68% נמצאים בתוך סטיית תקן אחת וכ-95% בתוך שתי סטיות תקן. ערכים אלו הם קירובים הקשורים למודל נורמלי הנזכר, ולא לכל מאגר נתונים סימטרי חסר-ערך.
גרף פיזור מציג זוגות של מדידות כמותיות. קו מתאים משמש לחיזוי תגובה; שארית היא הערך הנצפה פחות הערך החזוי. טבלה דו-כיוונית לעומת זאת משווה קטגוריות וחלקים תנאי. מגמה יכולה להראות קשר בלתי ישיר מבלי להוכיח סיבתיות, מכיוון שמשתנים אחרים או בחירה ייתכן שהסבירו את הקשר.
קו מתאים לא רשמי צריך לעקוב אחר המגמה הראשית ולא לחבר כל נקודה. יש לתאר כיוון, צורה ונקודות חריגות. אינטרפולציה בתוך הטווח הנצפה אמינה יותר מאשר אקסטרפולציה מרחוק. שינויים בקנה מידה גרפי יכולים לגרום לקשר שאינו משתנה להיראות חזק או חלש יותר, ולכן יש לקרוא את הקואורדינטות והצירים בפועל.
תדירות סופרת תצפיות חוזרות. ערכים 1, 3, 7 עם תדרים 2, 1, 1 מייצגים ארבע תצפיות: 1, 1, 3, 7. $\bar x=\sum fx/\sum f=(2(1)+1(3)+1(7))/4=3$. התיכון הוא $(1+3)/2=2$; אינו חייב להתאים לממוצע.
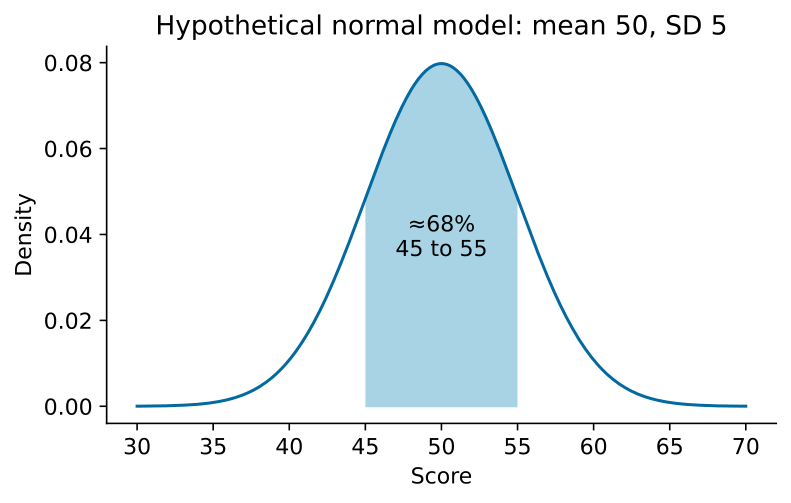
Worked example. A normal-model score distribution with mean 50 and standard deviation 5 places about 68% between 45 and 55 and about 95% between 40 and 60. Adding 10 shifts the mean to 60 but keeps standard deviation 5. For y=2x+4 at x=3, predicted y=10; an observed value 12 gives residual +2. These are hypothetical teaching models.
חומר לתרגול
כל שאלת תרגול למטה מציינת את כל הנתונים הנדרשים לה.
תרגול עם הסכמה
תרגול 1
A normal model has mean 80 and standard deviation 6. Give approximate central 68% and 95% intervals. Every score is changed to $z=2x+5$; give the transformed mean and standard deviation.
Reasoning. Under the stated normal model, about 68% lie in 74–86 and 95% in 68–92. Transformed mean is $2(80)+5=165$ and standard deviation $2(6)=12$. These are model proportions, not guarantees for a finite sample.
תרגול 2
A fitted model is $y=4x+3$. At $x=5$ observed $y=20$. Find predicted output and residual. Can a positive slope alone prove causation?
Reasoning. Prediction is $4(5)+3=23$. Residual $e=y_{obs}-y_{pred}=20-23=-3$. A positive slope gives association under the fit; confounding or selection can explain it without a direct cause.
תרגול 3
Data are 2,4,4,6,9,11,12,16. Using medians of the lower and upper halves, find the five-number summary and interquartile range. Which display preserves this summary: a box plot, a category bar chart or a scatterplot?
Reasoning. Median $Q_2=(6+9)/2=7.5$. Lower half 2,4,4,6 has $Q_1=4$; upper half 9,11,12,16 has $Q_3=11.5$. Five-number summary is $(2,4,7.5,11.5,16)$ and $IQR=Q_3-Q_1=7.5$. A box plot displays these values. A category bar chart compares categorical counts; a scatterplot needs paired quantitative measurements. Neither directly displays this univariate five-number summary. The stated quartile convention prevents disagreement between other valid quartile conventions.
תרגול 4
A hypothetical histogram has equal-width bins [0,10), [10,20), [20,30] with frequencies 2,6,2. State the proportion below 20 and whether the exact mean is determined. A scatterplot of hours and output rises with a curved trend and one high outlier: explain why a straight line joining every point is unsuitable.
Reasoning. Below 20 there are 2+6=8 of 10 observations, so 80%. The exact observations within bins are unknown, so no exact mean follows; midpoint estimates must be labelled estimates. A scatterplot represents pairs, and a fitted relation should describe its main shape with the unusual point considered. Joining every observation invents a path between separate cases and ignores the curved trend. Inspect actual axis scales and the outlier before fitting or extrapolating.
מגבלות ושימוש עתידי
אל תשתמש באחוזים נורמליים ללא תנאי דגם נורמלי או פרשן שיפוע פריסת פיזור כאפקט גרימה אוטומטי.
אלו משימות תרגול מקוריות שנכתבו לקורס זה, ולא שאלות מבחן רשמיות.