Forecasting: shape picks the method, MAD keeps score
Introduit| English | Sens |
|---|---|
| mean absolute deviation | the average size of forecast errors, ignoring sign |
| moving average/ˈmuːvɪŋ ˈævrɪdʒ/ | An average calculated over a fixed-size window that moves through a sequence of observations, helping smooth short-term variation. |
| exponential smoothing | a forecast that adds a fraction of the last error to the last forecast |
Every number in this course is a forecast in uniform
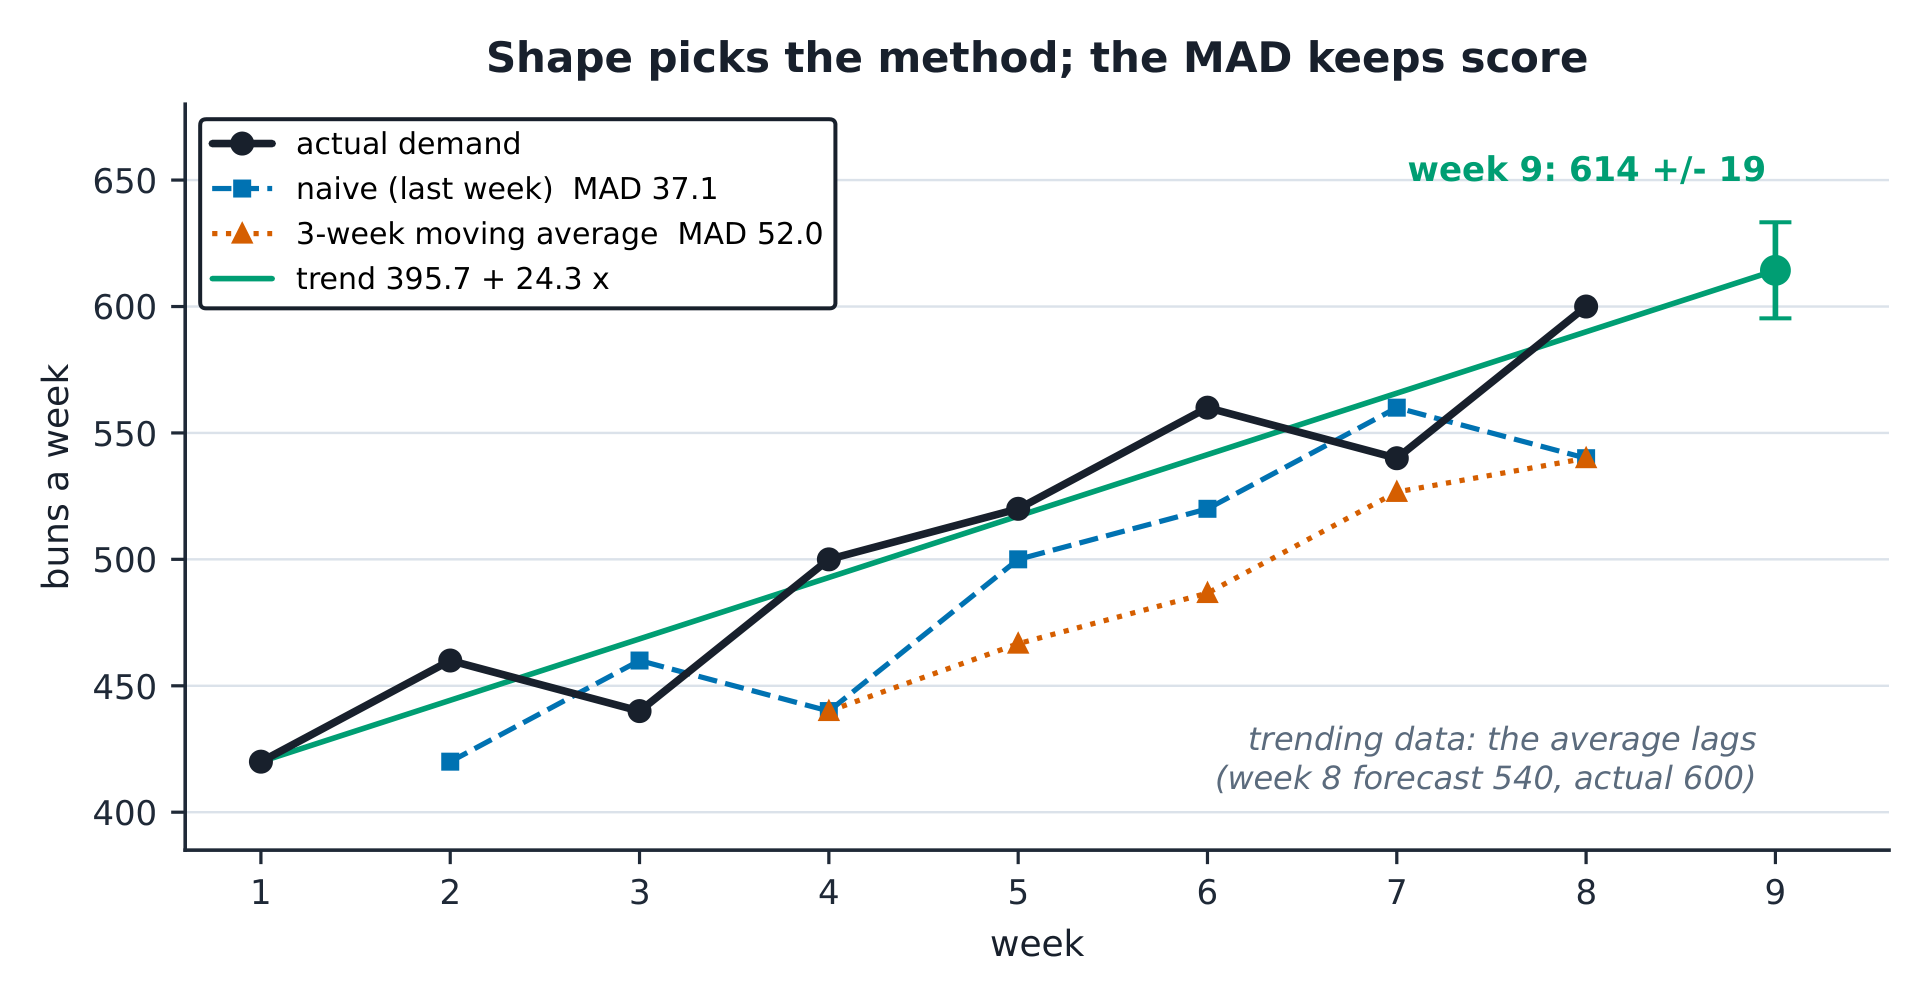
- Eight weeks of bun demand: 420, 460, 440, 500, 520, 560, 540, 600 - rising about 24 a week.
- The craft is matching the method to the shape, then measuring how wrong it is.
Three methods, one scoreboard
- Naive: last week's actual. Errors 40, -20, 60, 20, 40, -20, 60; the mean absolute deviation 平均绝对误差 is $260/7 = 37.1$.
- Three-week moving average 移动平均 from week 4: 440, 466.7, 486.7, 526.7, 540 against 500, 520, 560, 540, 600 - MAD $260/5 = 52.0$.
- Exponential smoothing 指数平滑 at $\alpha = 0.4$, seed 420: 420, 436, 437.6, 462.6, 485.5, 515.3, 525.2 - MAD 48.3.
Naive errors 40, -20, 60, 20, 40, -20, 60. The MAD (one decimal)?
Difficulté 2/5 · 140 pièces + un petit bonus lors de la première réussite aujourd'hui
$260/7 = 37.1$.
Three-week moving average forecast for week 8 from 520, 560, 540?
Difficulté 2/5 · 140 pièces + un petit bonus lors de la première réussite aujourd'hui
(520 + 560 + 540)/3 = 540.
Exponential smoothing, alpha 0.4, seed 420: week 2 actual 460. The forecast for week 3 (one decimal)?
Difficulté 2/5 · 140 pièces + un petit bonus lors de la première réussite aujourd'hui
$420 + 0.4 \times 40 = 436$.
Match each method to its MAD on these weeks.
Difficulté 2/5 · 140 pièces + un petit bonus lors de la première réussite aujourd'hui
Same scoreboard, same series - the shape decided the ranking.
The trend line and its band
- Least squares: $\hat{y} = 395.7 + 24.3x$; week 9 = 614. Residual sd 19.3 - quote $614 \pm 19$ as the two-thirds band and buy flour for the band.
- The average lost (52.0 against 37.1) because it drags a rising series down: week 8 forecast 540 against actual 600. Flat demand would reverse the verdict.
Which method fits this shape?
Route each demand pattern to the method built for it - and the scoreboard that arbitrates.
Trend 395.7 + 24.29x at x = 9, to the nearest bun?
Difficulté 2/5 · 140 pièces + un petit bonus lors de la première réussite aujourd'hui
395.7 + 218.6 = 614.3.
Why does the moving average lose to naive on this series?
Difficulté 1/5 · 100 pièces + un petit bonus lors de la première réussite aujourd'hui
Averages are built for flat demand; a trend leaves them behind (540 vs 600 in week 8).
The transparent adjustment
- The sales lead hears of a second festival stage: base 614 x 1.10 = 675, recorded as a judgemental uplift with the reason, the owner and the date.
- Actual 700: the adjusted number was 25 low (3.7%); the bare 614 would have been 86 low. The win is that the adjustment is auditable - next year's base gets a better prior.
Base 614 with a recorded +10% uplift gives:
Difficulté 1/5 · 100 pièces + un petit bonus lors de la première réussite aujourd'hui
614 x 1.10 = 675.4.
Three forecasting slips
- Scoring on different weeks. The moving average has no forecast for weeks 1-3; score like with like.
- Raising alpha to chase noise. 0.4 follows a trend; 0.8 tracks the weather.
- Hiding the uplift inside the number. Write it beside the number it moved.
Score the moving average on weeks 1 to 3 as well, where it has no forecast.
Difficulté 1/5 · 100 pièces + un petit bonus lors de la première réussite aujourd'hui
Score like with like: the average has forecasts only from week 4.
Recap
- Shape picks the method; MAD keeps score: naive 37.1, MA3 52.0, ES 48.3.
- Trend 395.7 + 24.3x gives 614 +/- 19 for week 9.
- Forecast a band, and write every judgement beside it.