Energy transfer: use production and a stated boundary
Introduit| English | Sens |
|---|---|
| trophic transfer efficiency/ˈtrəʊfɪk ˈtrænsfɜː ɪˈfɪʃənsi/ | efficacité du transfert trophique |
| assimilation/əˌsɪmɪˈleɪʃn/ | assimilation |
What would explain this observation?
- Energy available as new biomass usually decreases along a food chain. Energy is conserved overall, but some transferred energy leaves the next-level production pathway.
Build the model
- Producers convert an energy input into chemical energy in organic material.
- Consumers obtain material by feeding.
- Trophic transfer efficiency 营养级传递效率 compares production available at one level with production at the preceding level over a common area and time.
- Energy can enter detrital pathways, remain in uneaten material, leave in egested waste or be transferred as heat through respiration.
- trophic transfer efficiency: Production at one trophic level divided by production at the preceding level over a common interval.
- assimilation 同化: Uptake of digested material into an organism’s usable internal pool.

Which pair can be used for the stated transfer-efficiency calculation?
Difficulté 1/5 · 100 pièces + un petit bonus lors de la première réussite aujourd'hui
Transfer efficiency is a ratio of productions, so both values must be production in the same area, time and energy units. Mixing counts, standing biomass or unmatched units produces a meaningless number.
Match each technical term to its precise meaning.
Difficulté 2/5 · 140 pièces + un petit bonus lors de la première réussite aujourd'hui
Use the definitions to distinguish related quantities and processes.
Choose evidence that can test it
- Use the same energy units and period in numerator and denominator.
- Distinguish ingestion, assimilation and production: consumed energy is not all assimilated, and assimilated energy is not all stored as new biomass.
- An energy pyramid records a flow per area per time; a standing biomass snapshot is a different quantity.
In the lab: Analyse attributed or fictional ecosystem budget data. Draw a boundary and arrows for feeding, detritus and heat transfer. Identify which values are measured and which inferred, and check whether the budget includes decomposers. Avoid treating a fixed 10% rule as a universal measurement for every ecosystem.
Which two habits make the investigation or model in this case more defensible?
Difficulté 2/5 · 140 pièces + un petit bonus lors de la première réussite aujourd'hui
Stating the conditions and assumptions lets others repeat the work exactly, and recording the supporting evidence lets them check the conclusion. Hiding disagreeing results removes the evidence that could challenge a wrong conclusion, and one measurement can never establish a wider claim.
Work from known quantities
- Known: producer production is 10,000 kJ/m²/year and primary-consumer production is 1,200 kJ/m²/year.
- Transfer efficiency is 1,200/10,000×100=12%.
- Secondary-consumer production of 180 kJ/m²/year gives 180/1,200×100=15% for that step.
- These different values show why a universal 10% assumption would misrepresent this dataset.
Your turn: Producer production is 8,000 and primary-consumer production is 800 kJ/m²/year. Calculate transfer efficiency.
Different transfer steps, different efficiencies
10,000 → 1,200 → 180 kJ per m² per year gives 12% then 15% transfer efficiency, and 1.8% overall. Keep production, area and time consistent while accounting for the remaining energy pathways.
Producer production is 8,000 and primary-consumer production is 800 kJ/m²/year. Calculate transfer efficiency.
Difficulté 2/5 · 140 pièces + un petit bonus lors de la première réussite aujourd'hui
The result is 10 %. Known: producer production 8,000; primary-consumer production 800 kJ per square metre per year. Use efficiency = consumer production / producer production x 100. Efficiency = 800/8,000 x 100 = 10%. Other steps in the same system can differ, as the worked case shows.
Check the conclusion and its limits
- Energy is not destroyed when respiration transfers it as heat.
- Material can cycle through an ecosystem, while usable energy flow depends on continuing input.
- A count pyramid or biomass snapshot cannot automatically be substituted into an energy-efficiency calculation.
Not true: Respiration destroys energy instead of transferring it to other forms. Respiration transfers energy to the surroundings as heat - the energy still exists. "Loss" between trophic levels means energy leaves the food chain's usable flow; conservation is never violated.
- Producers convert an energy input into chemical energy in organic material.
- Use the same energy units and period in numerator and denominator.
- Watch for: energy is not destroyed when respiration transfers it as heat.
Respiration destroys energy instead of transferring it to other forms.
Difficulté 1/5 · 100 pièces + un petit bonus lors de la première réussite aujourd'hui
Respiration transfers energy to the surroundings as heat - the energy still exists. "Loss" between trophic levels means energy leaves the food chain's usable flow; conservation is never violated.
Production at one trophic level divided by production at the preceding level over a common interval: write the technical term.
Difficulté 1/5 · 100 pièces + un petit bonus lors de la première réussite aujourd'hui
trophic transfer efficiency means Production at one trophic level divided by production at the preceding level over a common interval.
Write from a transfer efficiency of 15 percent
- Producer production is 6,000 and primary-consumer production is 900 kJ per square metre per year.
- Find the transfer efficiency. Respiration transfers energy. It does not destroy it.
Producer production is 6,000 and primary-consumer production is 900 kJ per square metre per year. What is the transfer efficiency, and what happens to energy in respiration?
Transfer efficiency = consumer production/producer production × 100 = 900/6,000 × 100 = 0.15 × 100 = 15%. Use matching area and time units. Respiration transfers energy to ATP and heat; it does not destroy energy.
The SL written case gives producer production 6,000 and consumer production 900, in matched annual area units. Calculate transfer efficiency.
Difficulté 1/5 · 100 pièces + un petit bonus lors de la première réussite aujourd'hui
900 divided by 6,000 is 0.15, so the efficiency is 15 percent. Other options — 10 percent (the lesson example's result for 800 from 8,000); 900 (the consumer production).
Draw a boundary before balancing a system
- An open ecosystem exchanges matter and energy with its surroundings. A pond receives sunlight, rain, minerals and imported organic matter, while heat, water and organisms can leave. In an invented annual carbon budget, inputs of 120 kg and outputs of 95 kg increase storage by 25 kg if all external transfers are included.
- Feeding from algae to grazers inside that pond is an internal transfer, not another external input. A closed system exchanges energy but not matter; an isolated system exchanges neither. A sealed transparent vessel can receive light and lose heat, so a lid does not make it isolated. State whether the boundary is one organism, a pond or a larger region.
An invented pond receives 120 kg carbon and exports 95 kg during a year. Assume all external transfers are included. Find storage change.
Difficulté 2/5 · 140 pièces + un petit bonus lors de la première réussite aujourd'hui
120 − 95 = +25 kg carbon. Transfers between algae and grazers inside the pond do not add another external input.
Identify carbon and energy sources separately
- Photoautotrophs use light energy to build organic compounds from inorganic carbon. Chemoautotrophs use chemical oxidation energy: in an iron-oxidizing example, reduced iron supplies electrons and energy while carbon dioxide supplies carbon. Iron does not become the carbon in sugar, and not every bacterium associated with iron is autotrophic.
- Heterotrophs obtain organic carbon made by other organisms and assimilate absorbed material into usable compounds and tissues. Both producers and consumers respire. An unlit cave may receive leaves or waste whose energy was captured by photosynthesis elsewhere; darkness alone does not establish local chemosynthetic production.
Follow feeding arrows towards the receiver
- A food-web arrow runs from food to feeder, showing transfer of organic matter and energy. In grass → grasshopper → frog → snake, the grasshopper is a primary consumer, frog secondary and snake tertiary on that route. The arrow is not the direction in which a predator attacks.
- A species can occupy different trophic positions on different routes: a bird eating seeds is primary on that route and secondary when eating herbivorous insects. Build a local web from supported diet evidence, rather than assuming that organisms sharing a habitat eat one another. An unquantified link shows a route, not its exact transfer rate.
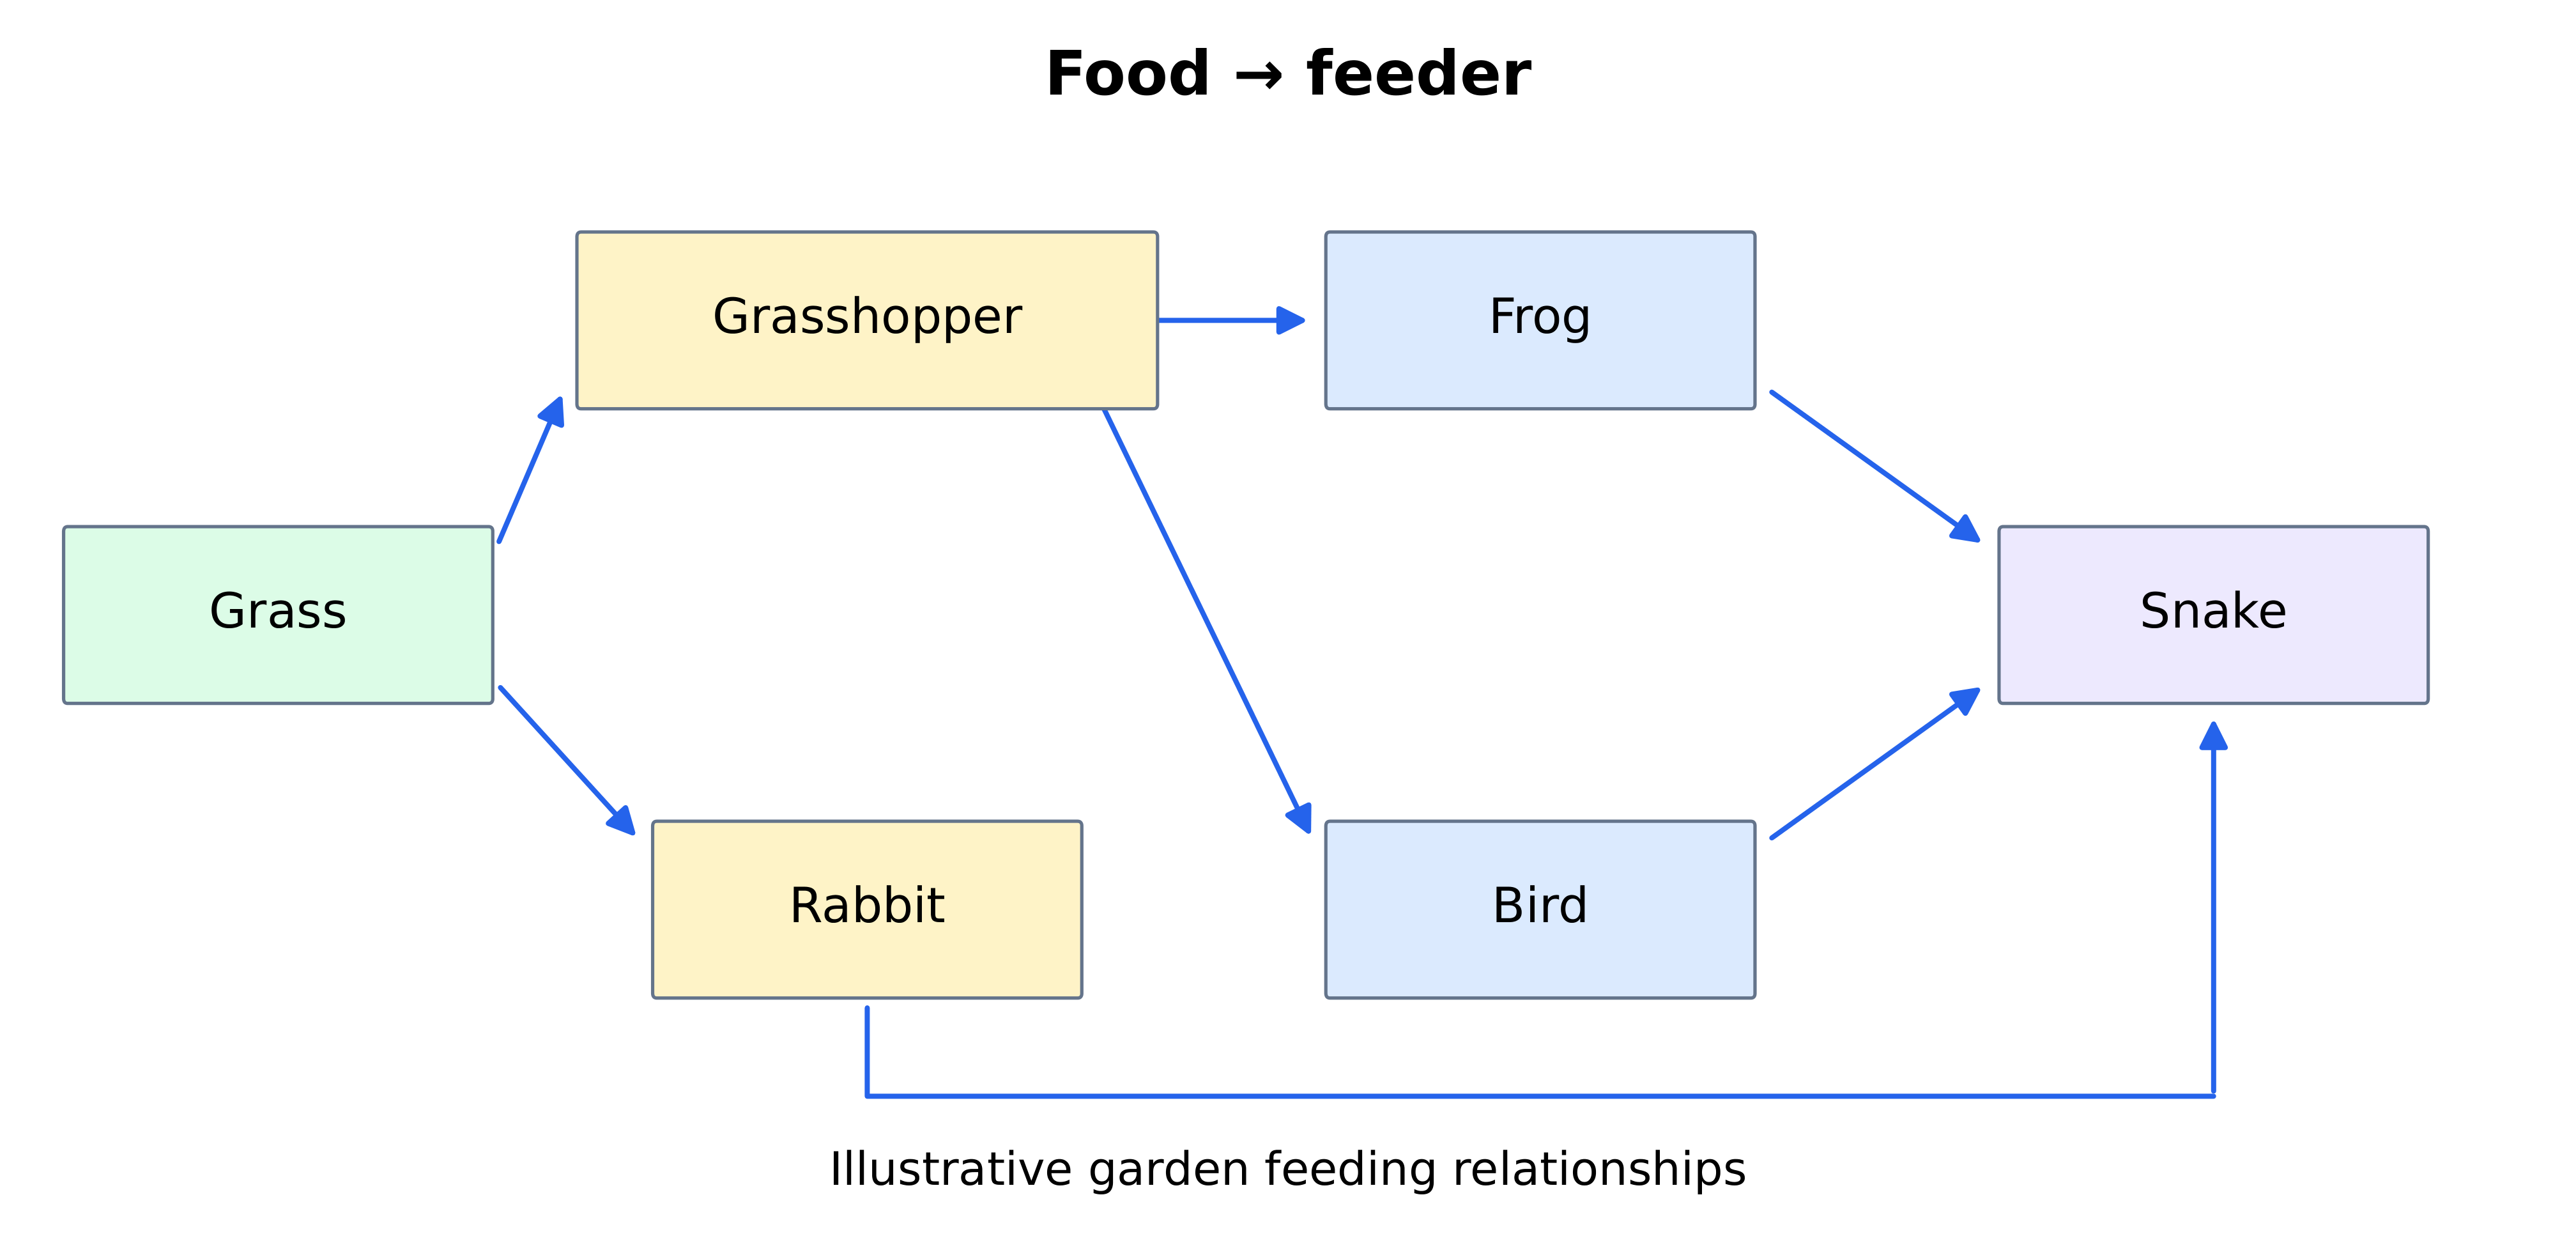
Put detrital routes beside every trophic level
- Dead organisms, leaves, shed parts and faeces retain organic material with chemical energy. Detritus feeders ingest this material; many decomposer fungi and bacteria digest externally and absorb products. Dead matter can arrive from producers or any consumer level, rather than only after the final predator.
- Decomposers use absorbed compounds in growth and respiration. Mineralization can return nutrients producers use, while respiration releases carbon dioxide and transfers energy. Matter can be recycled; dispersed heat does not become new sunlight. Energy absent from the next grazing level may still support detrital organisms before becoming heat.
Distinguish a biomass stock from a production rate
- Gross primary production, GPP, is total fixation into organic compounds; net primary production, NPP, subtracts the producers' own respiratory use. Secondary production is new heterotroph biomass through growth and reproduction, rather than everything ingested or absorbed.
- Production needs an interval, for example kilojoules per square metre per year or grams of carbon per square metre per year. Standing biomass is an amount at one time. Carbon mass, total dry mass and energy cannot be exchanged by relabelling units; a conversion needs a stated carbon fraction or energy content.
Calculate net production and turnover on matching bases
- For invented annual area-based energy equivalents, GPP of 18,000 and producer respiration of 8,000 leave NPP of 10,000. Consumer respiration is not the subtraction used to define NPP, although it matters in the whole-community budget.
- An algal stock of 20 grams of carbon per square metre and annual production of 400 on the same carbon/area basis give production divided by stock of 20 per year. Rapid replacement permits high production with a small standing stock. A start-to-end stock difference alone can miss new tissue that was eaten, died or left during the interval.
In an invented annual area-based budget, GPP is 18,000 and producer respiration 8,000 kilojoules per square metre per year. Calculate NPP in the same units.
Difficulté 2/5 · 140 pièces + un petit bonus lors de la première réussite aujourd'hui
NPP = GPP − producer respiration = 18,000 − 8,000 = 10,000. Consumer respiration belongs in other balances, rather than the definition of producer NPP.
Balance a consumer's ingestion, assimilation and production
- In an invented fixed-area, fixed-period budget, ingestion is 2,000 kJ and unassimilated faecal loss is 800, leaving assimilation of 1,200. Respiratory use of 1,000 leaves new biomass production of 200. Here other organic losses are assumed zero; a fuller budget must include them where appropriate.
- Faecal egestion differs from metabolic excretion. Egested organic material still contains chemical energy and can enter detrital routes. The flow arrows below show a balance, rather than widths proportional to amounts; identify the values and assumptions before calculating an efficiency.
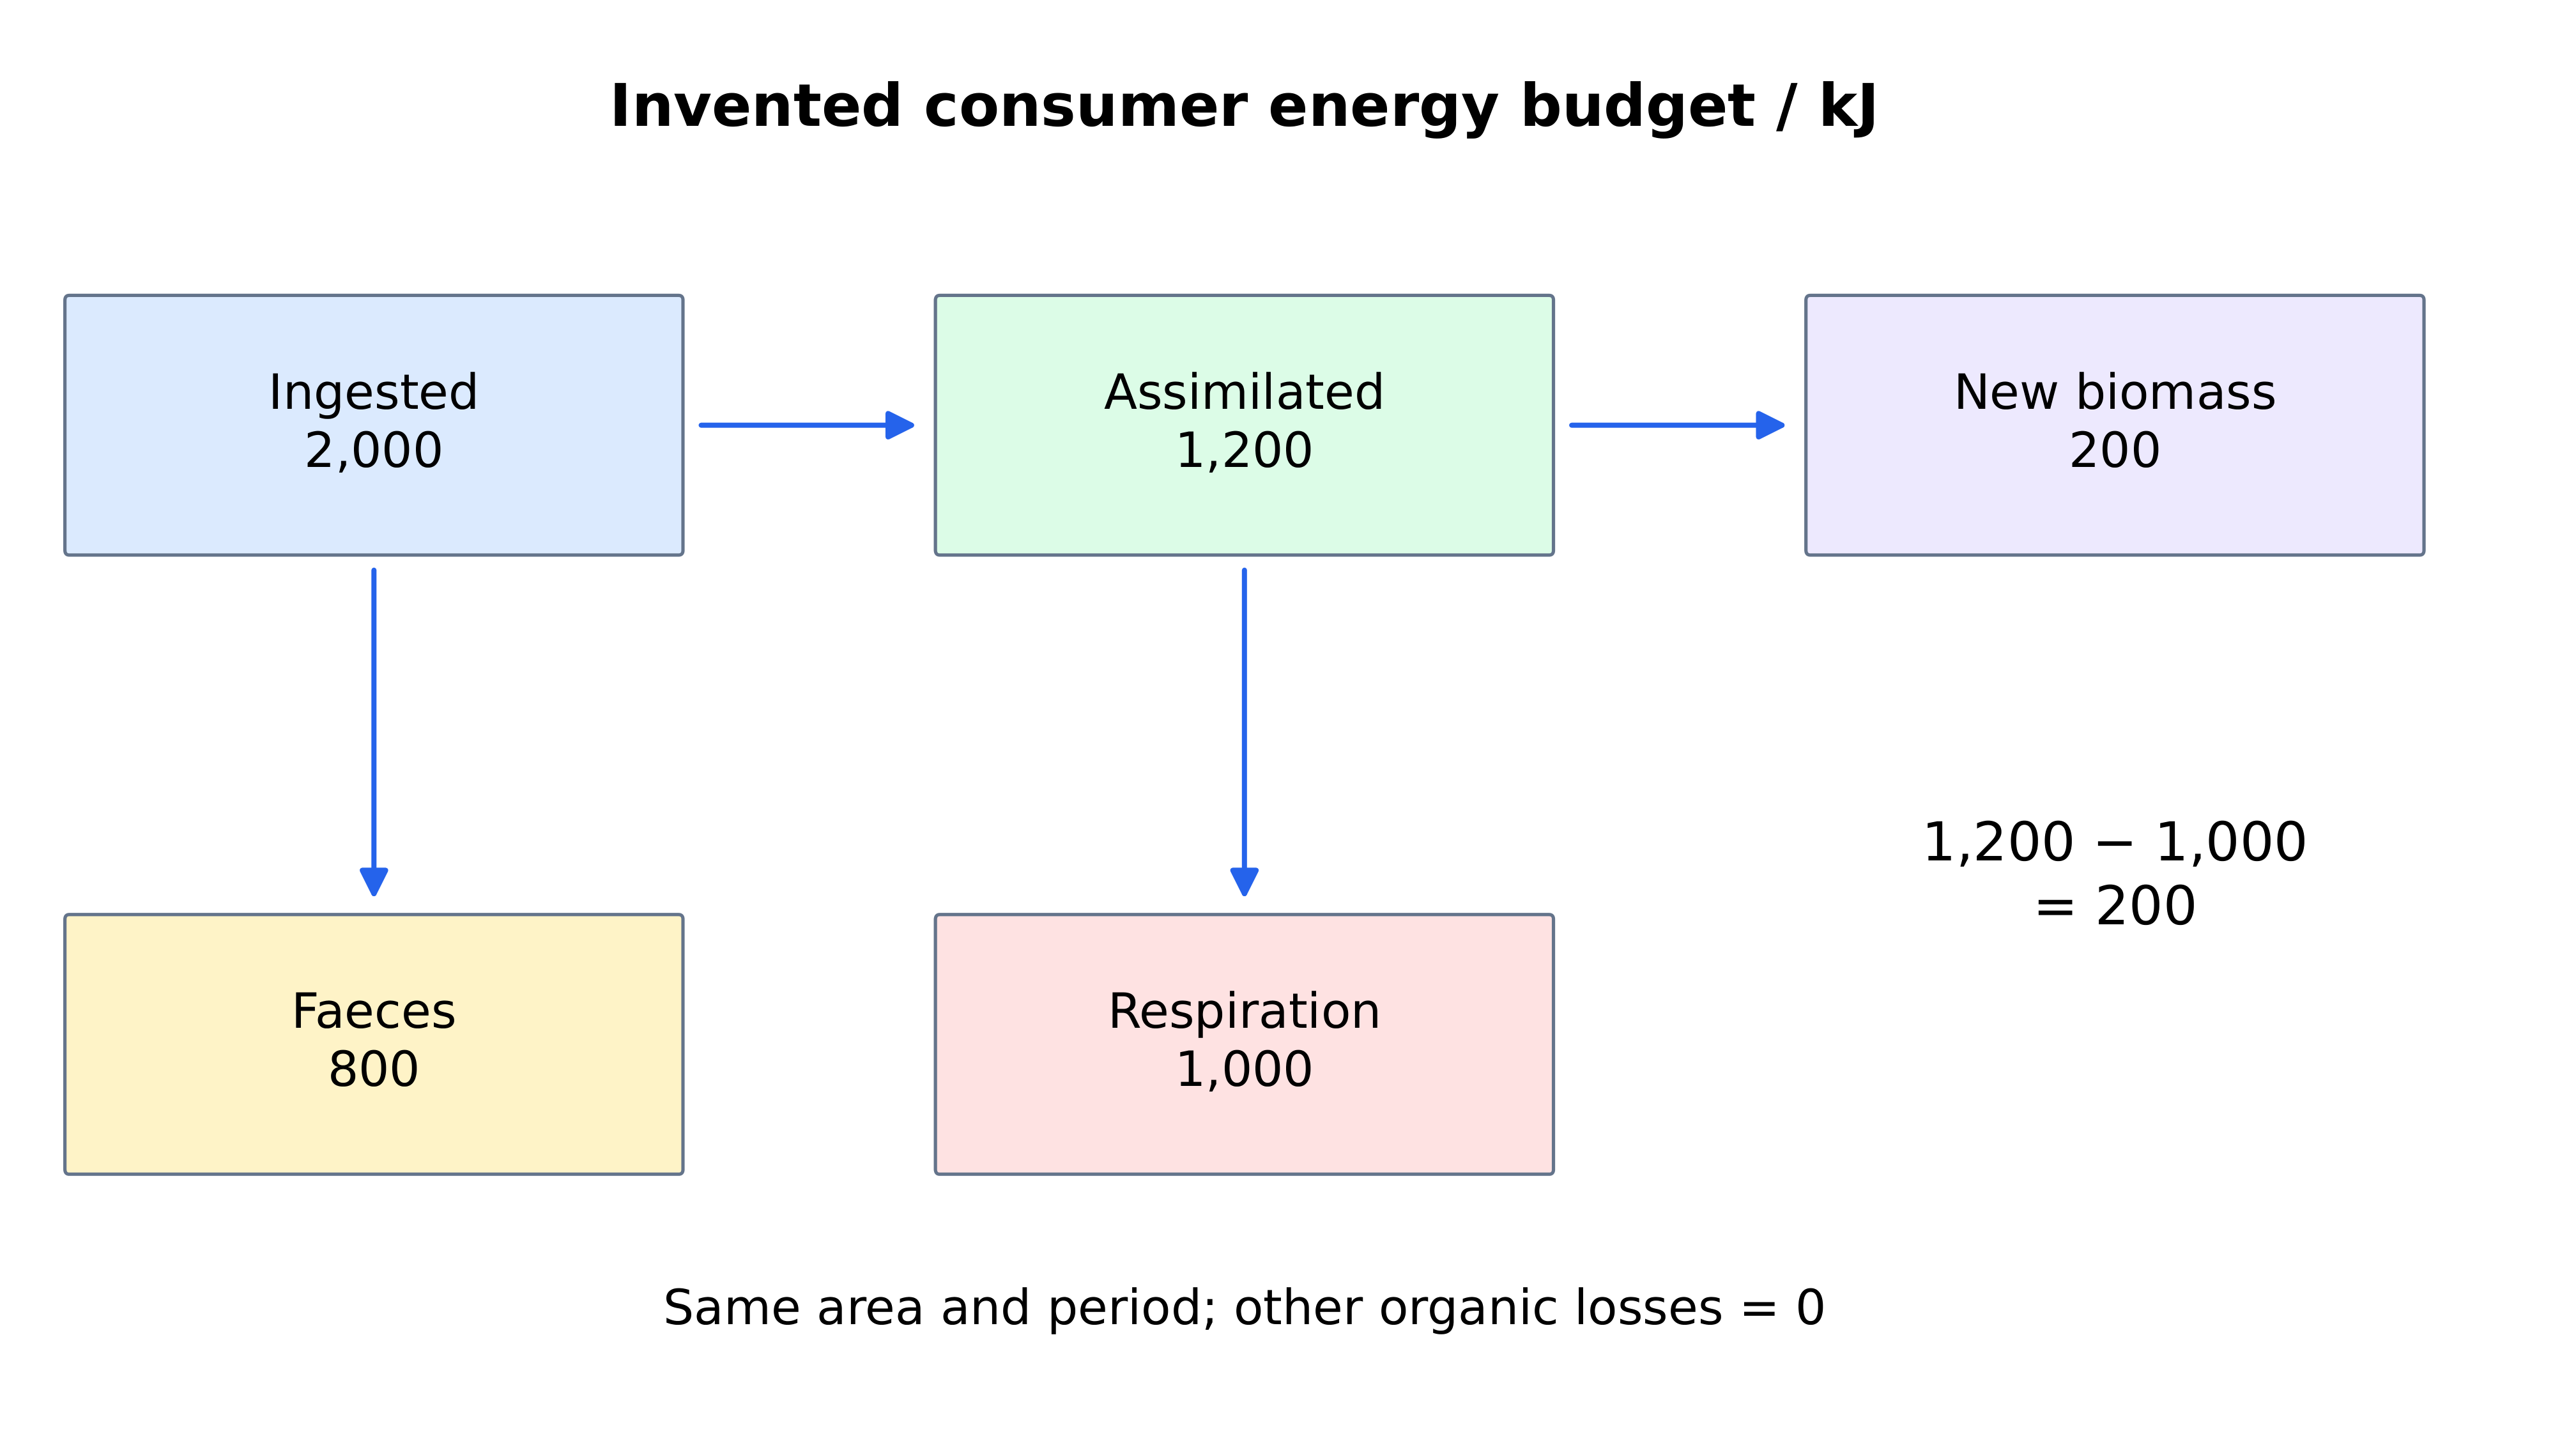
An invented consumer ingests 2,000 kJ, loses 800 in unassimilated faeces and uses 1,000 in respiration over a stated period. Other organic losses are zero. Find new biomass production.
Difficulté 2/5 · 140 pièces + un petit bonus lors de la première réussite aujourd'hui
Assimilation = 2,000 − 800 = 1,200 kJ; production = 1,200 − 1,000 = 200 kJ. Ingestion and assimilation are not themselves production.
Name the denominator in each efficiency
- In that budget, assimilation/ingestion is 60%, production/assimilation about 16.7%, and production/ingestion 10%. They answer different questions. If supporting producer NPP is 10,000 kJ over the same area and period, the consumer's 200 kJ production is only 2% of it.
- That 2% is the producer-to-consumer production comparison; the 10% production/ingestion result is not interchangeable. Uneaten producer material may remain, die, be exported or enter another feeding route. It has not automatically all been respired by this consumer.
An invented matched-area, matched-period pathway has producer NPP of 10,000 kJ and herbivore production of 200 kJ. Find the production transfer percentage.
Difficulté 2/5 · 140 pièces + un petit bonus lors de la première réussite aujourd'hui
200/10,000 × 100 = 2%. The separate consumer budget can give 10% production/ingestion; that is a different denominator and comparison.
Construct a pyramid from matched production flows
- For invented annual production values of 10,000, 1,200 and 180 kilojoules per square metre, the two step efficiencies are 12% and 15%. The final level receives 1.8% of producer production: multiply 0.12 by 0.15, rather than adding the percentages.
- Draw equal-height bars with widths proportional to values on one linear scale, producers at the base. Label values, groups, units and interval. A hidden logarithmic width scale would change what the areas mean. A count pyramid or standing-biomass snapshot cannot substitute for these matched production flows.
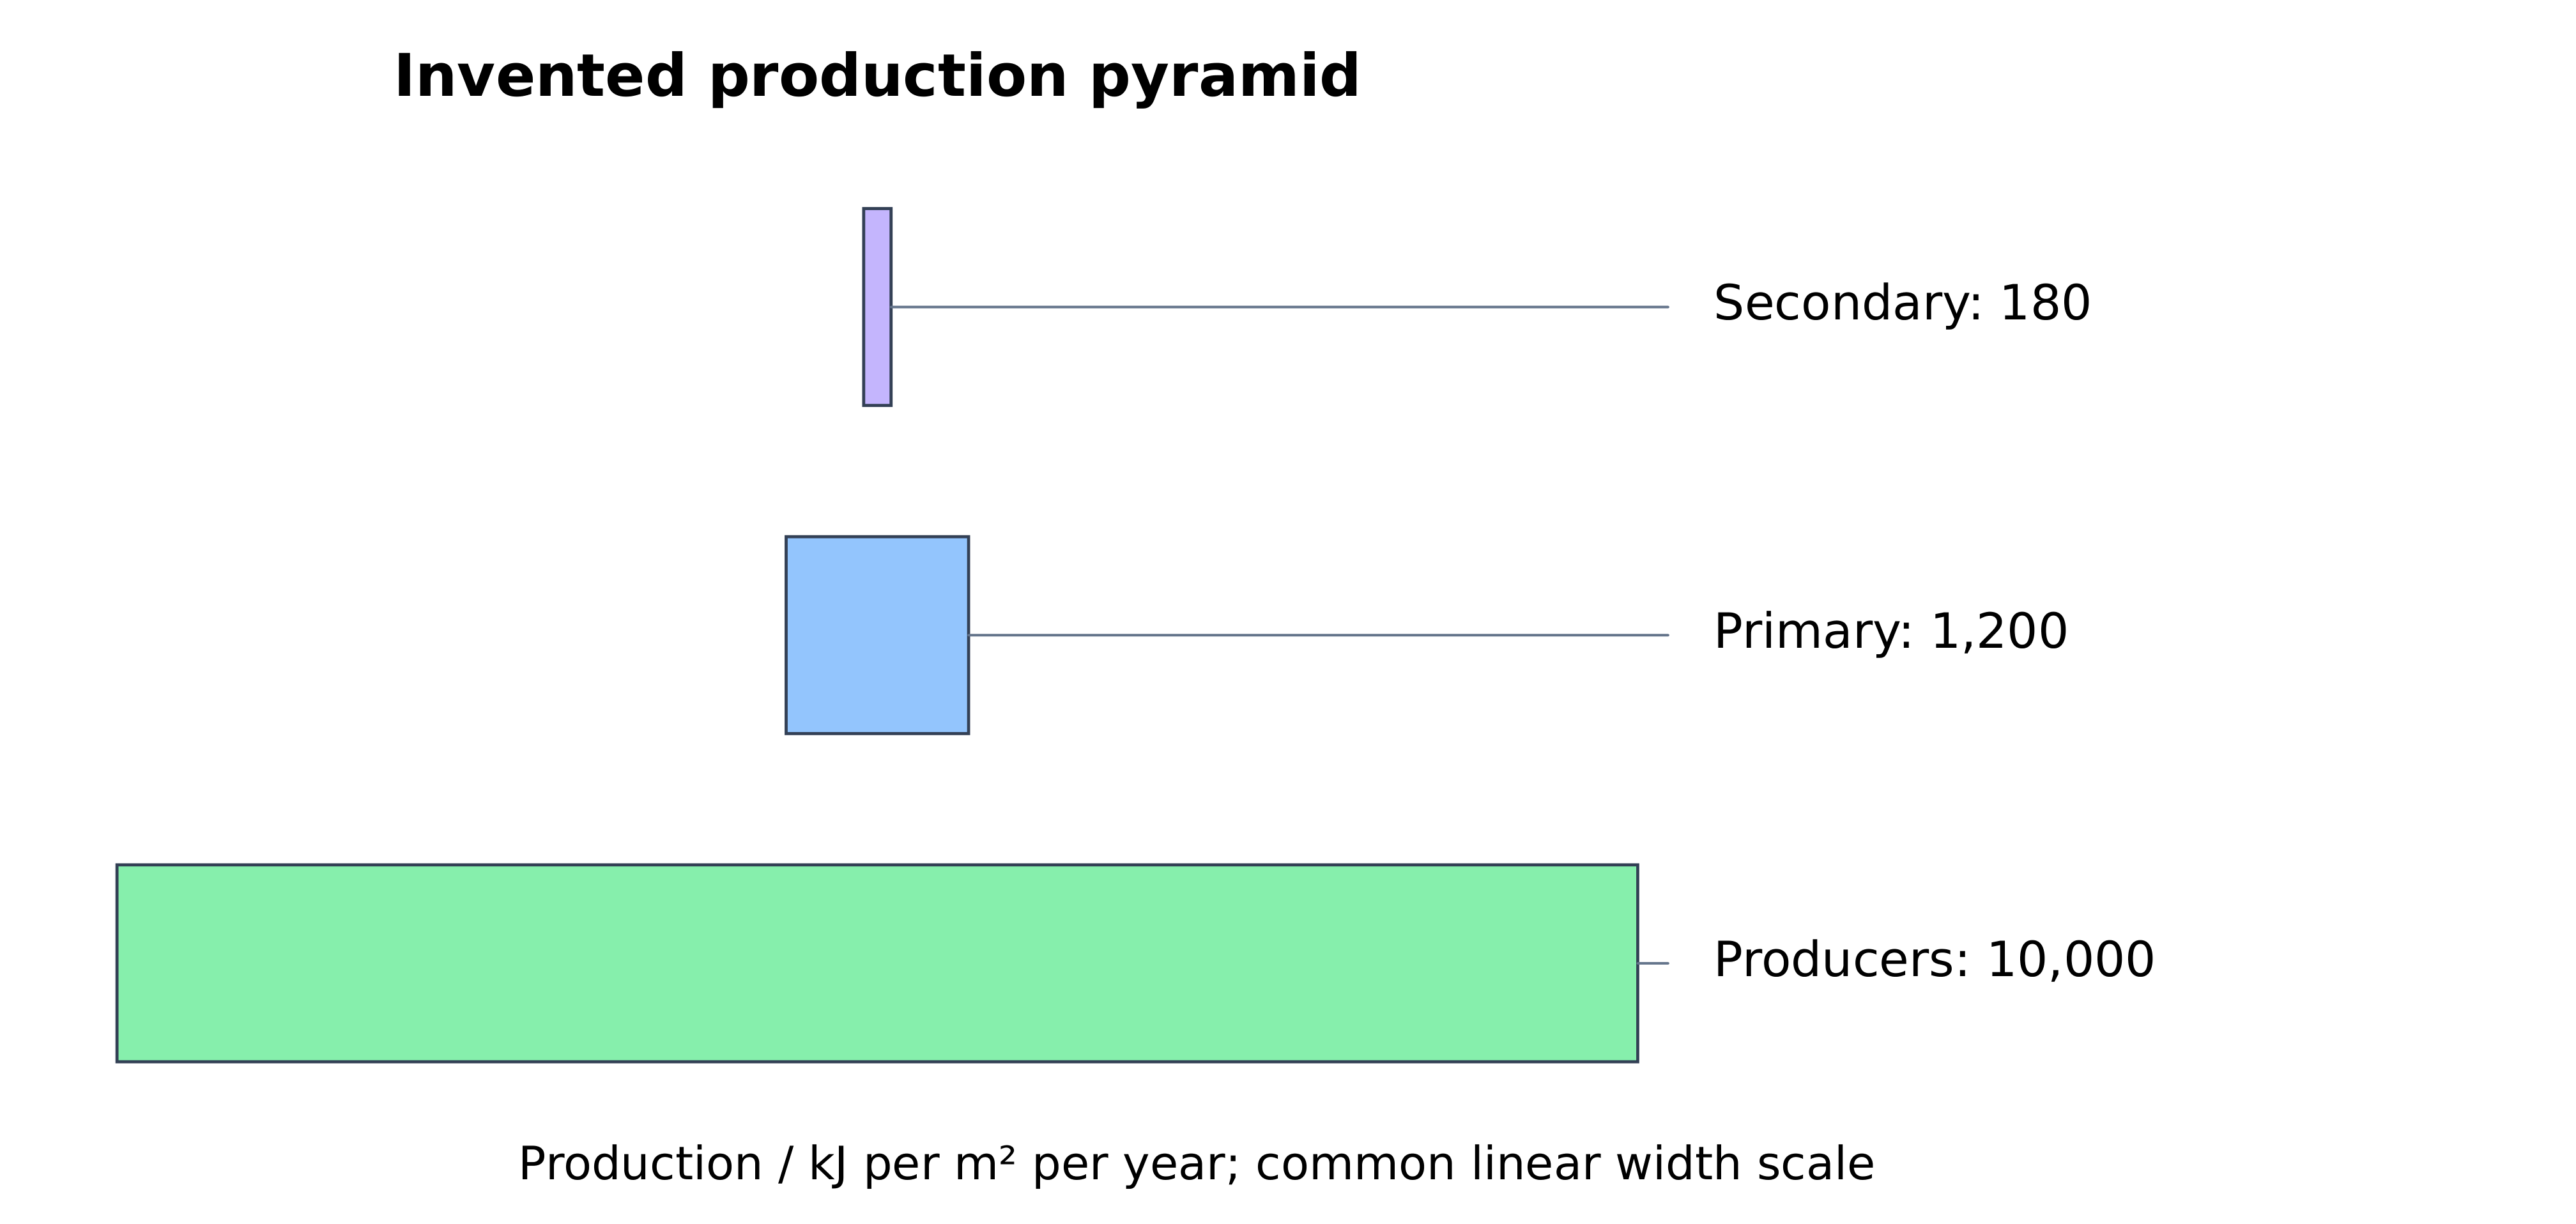
An invented chain transfers 12% of producer production to primary consumers, then 15% of that production to secondary consumers. What percentage of initial producer production reaches secondary-consumer production?
Difficulté 2/5 · 140 pièces + un petit bonus lors de la première réussite aujourd'hui
0.12 × 0.15 = 0.018, or 1.8%. Multiply step fractions; adding 12% and 15% would not represent the serial transfers.
Check a published study's definition before plotting it
- Figure 7 and its notes in Odum's Silver Springs study distinguish production from intake. Rough annual consumer-production estimates are 1,478, 67 and 6 kilocalories per square metre for herbivores, carnivores and top carnivores. The later step ratios are about 4.53% and 8.96%, rather than one fixed 10%.
- These are historical estimates in a complex open community, not precise values for one isolated three-species chain. Keep the original definitions, calorie units, area and year; do not relabel the paper's larger intake numbers as new biomass. Compare orders of magnitude and uncertainty alongside calculated ratios.
Explain lower support for higher consumers without destroying energy
- Some material is uneaten; some ingested material is unassimilated; organisms respire much of what they assimilate. Energy is conserved but becomes dispersed heat or leaves the specified production pathway. These processes usually reduce production available to support successive consumers and limit feasible chain length.
- A hypothetical 10% transfer model starting with 10,000 units gives 1,000, 100, 10 and 1 over four steps, not a measured universal rule. A biomass snapshot can be inverted when rapidly replaced phytoplankton support a larger standing consumer stock. Imported food and different intervals also matter; neither energy conservation nor these comparisons requires every predator to be smaller than its prey.
Trace carbon atoms through named processes
- Photosynthesis transfers carbon dioxide into producer organic compounds; feeding transfers organic carbon to consumers. Death and egestion supply detritus, decomposer uptake builds biomass, and respiration by all these living groups returns carbon dioxide. Boxes are stores; arrows require process labels and a stated direction.
- Aerobic respiration uses oxygen released by oxygenic photosynthesis and returns carbon dioxide that can be fixed again. The oxygen gas released by photosynthesis comes from water, rather than merely removing carbon from carbon dioxide. Following carbon atoms differs from following the associated energy transformations.
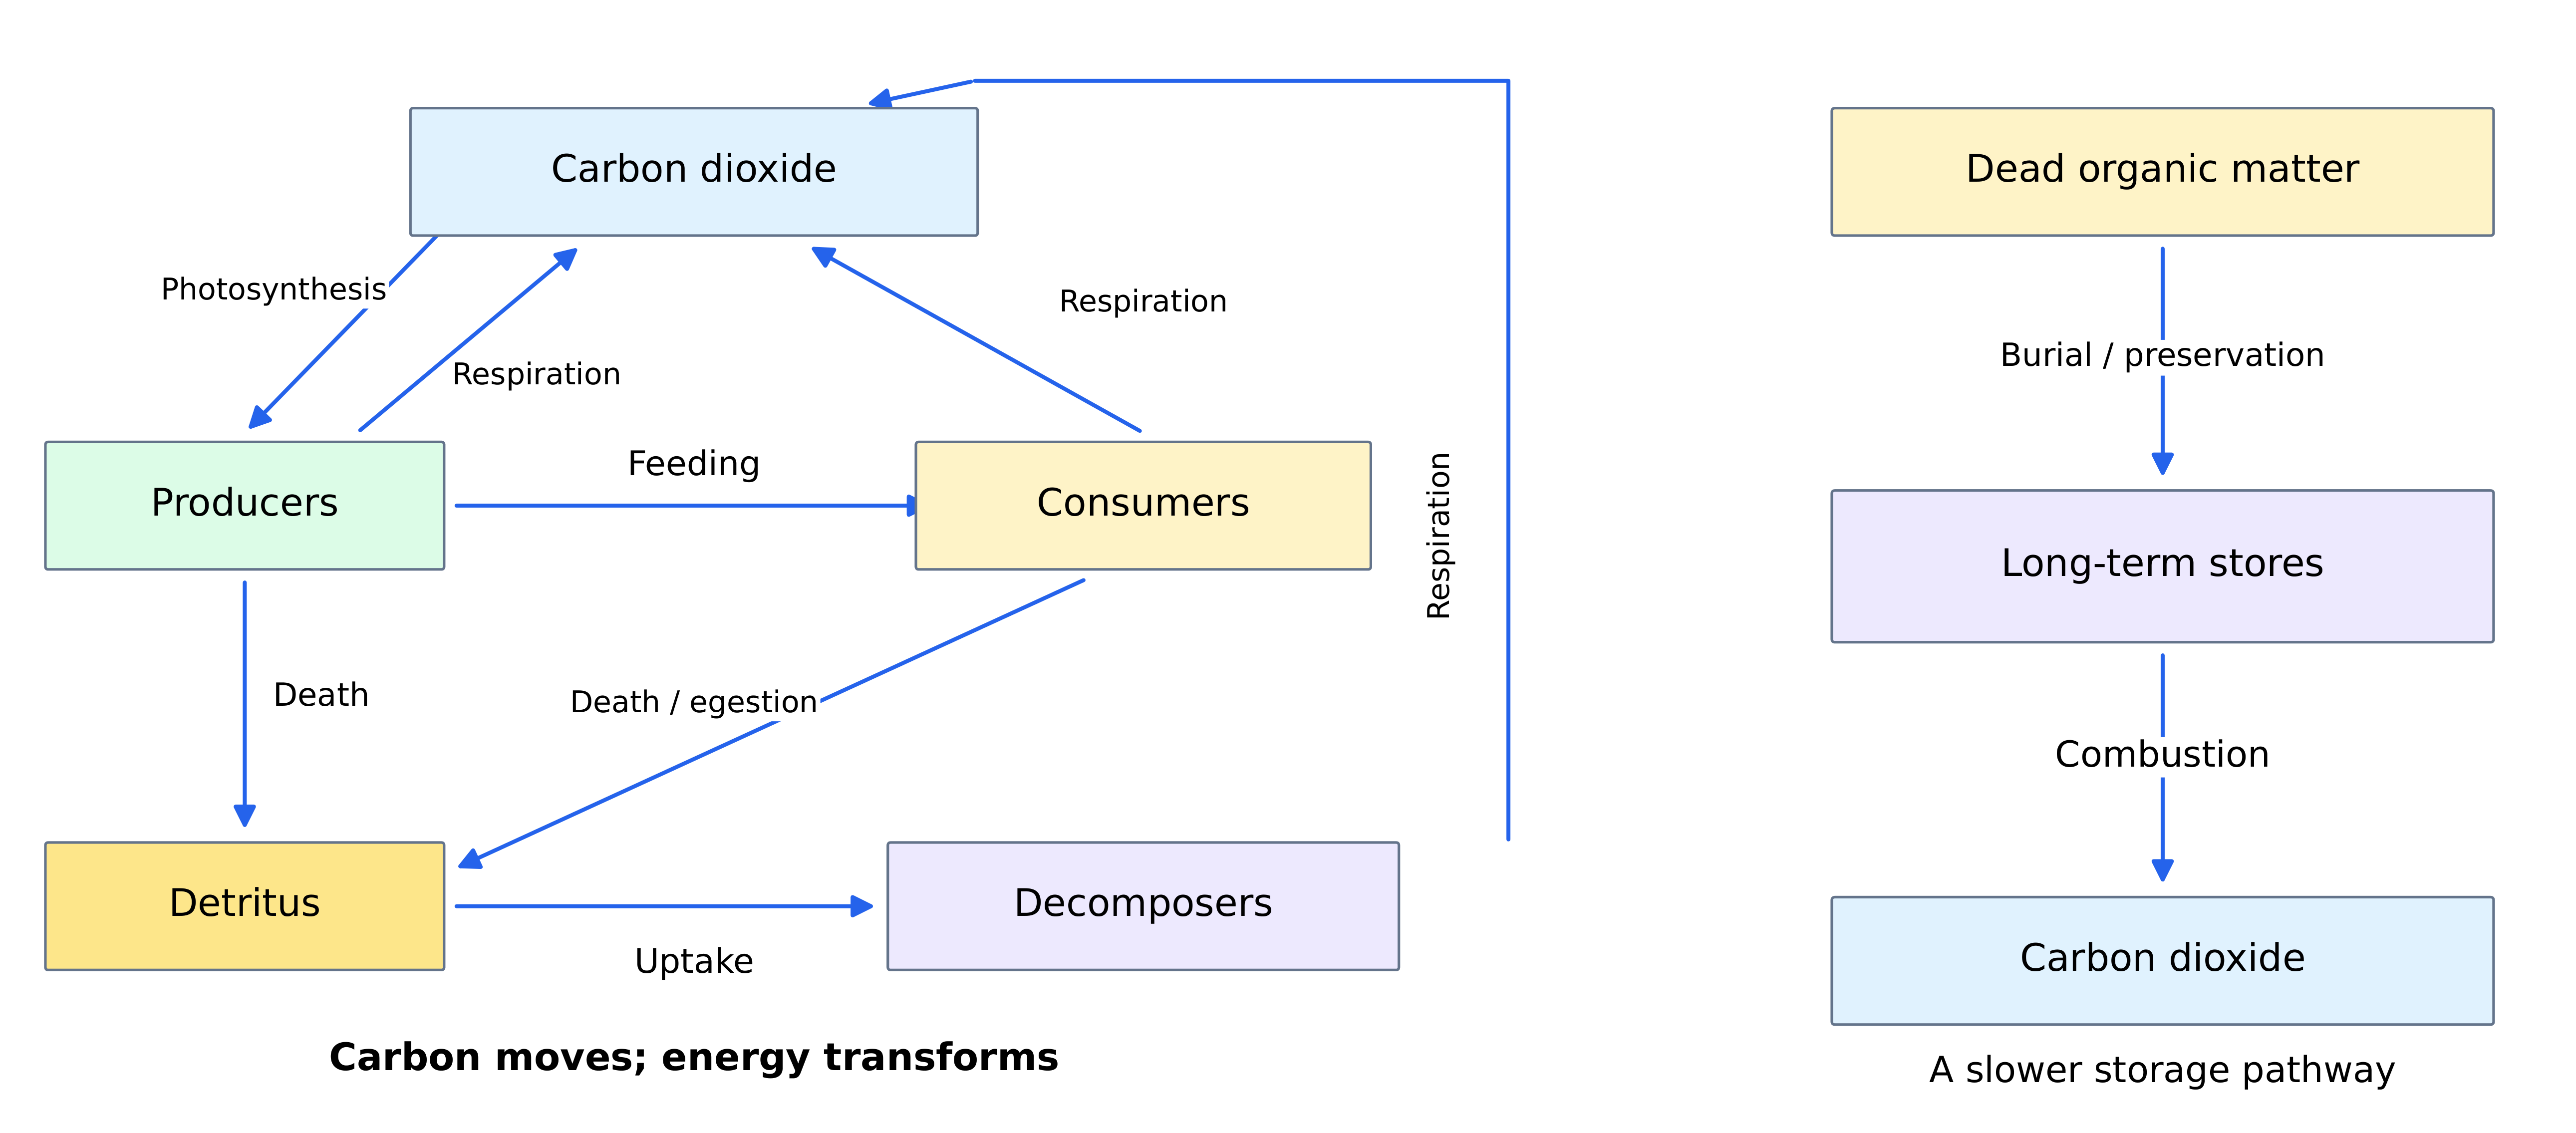
Separate carbon storage timescales from combustion
- Organic material can accumulate when production exceeds breakdown; waterlogged, oxygen-poor conditions can favour peat accumulation. Geological burial contributed to fossil stores with differing origins and formation conditions. Coal, oil and gas are not replaced by last year's ordinary leaf fall on human timescales.
- Combustion of biomass, peat or fossil fuels oxidizes carbon compounds, releasing carbon dioxide and energy. Lightning can start natural fires; human activities release old stores much faster than replacement. Burning recent biomass releases carbon dioxide immediately, while any later balance depends on actual regrowth, boundary and interval rather than instant carbon neutrality.
Decide sink or source from a complete net balance
- A carbon store is an amount; a sink has greater uptake than release during a stated interval, while a source has greater release. With invented fixation of 900, producer respiration 350 and heterotrophic respiration 400 grams of carbon per square metre per year, NPP is 550 but the simplified net uptake is only 150.
- If whole-community respiration were instead 980 with fixation 900, the system would release a net 80 and be a source. An open budget must also include fire, harvest, dissolved carbon and other imports/exports where relevant. A large forest stock is not automatically a large current sink, and photosynthesis minus respiration alone need not equal total storage change.
An invented ecosystem fixes 900, uses 350 in producer respiration and 400 in heterotrophic respiration, all in grams carbon per square metre per year. Other fluxes are zero. Find net uptake.
Difficulté 2/5 · 140 pièces + un petit bonus lors de la première réussite aujourd'hui
900 − 350 − 400 = 150 net uptake, a sink in this simplified balance. NPP alone is 550 and would overstate the whole-community net uptake.
Read seasonal and corresponding-month carbon dioxide changes
- NOAA's historical monthly Mauna Loa means are 419.09 ppm in May 2021, 413.26 in September 2021 and 420.97 in May 2022. The within-year fall is 5.83 ppm; the corresponding-May rise is 1.88 ppm. These dated values are not present-day concentrations.
- Ppm here expresses mole fraction in dry air: 419.09 ppm is 0.041909%. The graph measures concentration, not a factory count or one forest's photosynthesis. Monthly means and NOAA's seasonally adjusted values are different series; a seasonal decline can coexist with a rising longer-term baseline.
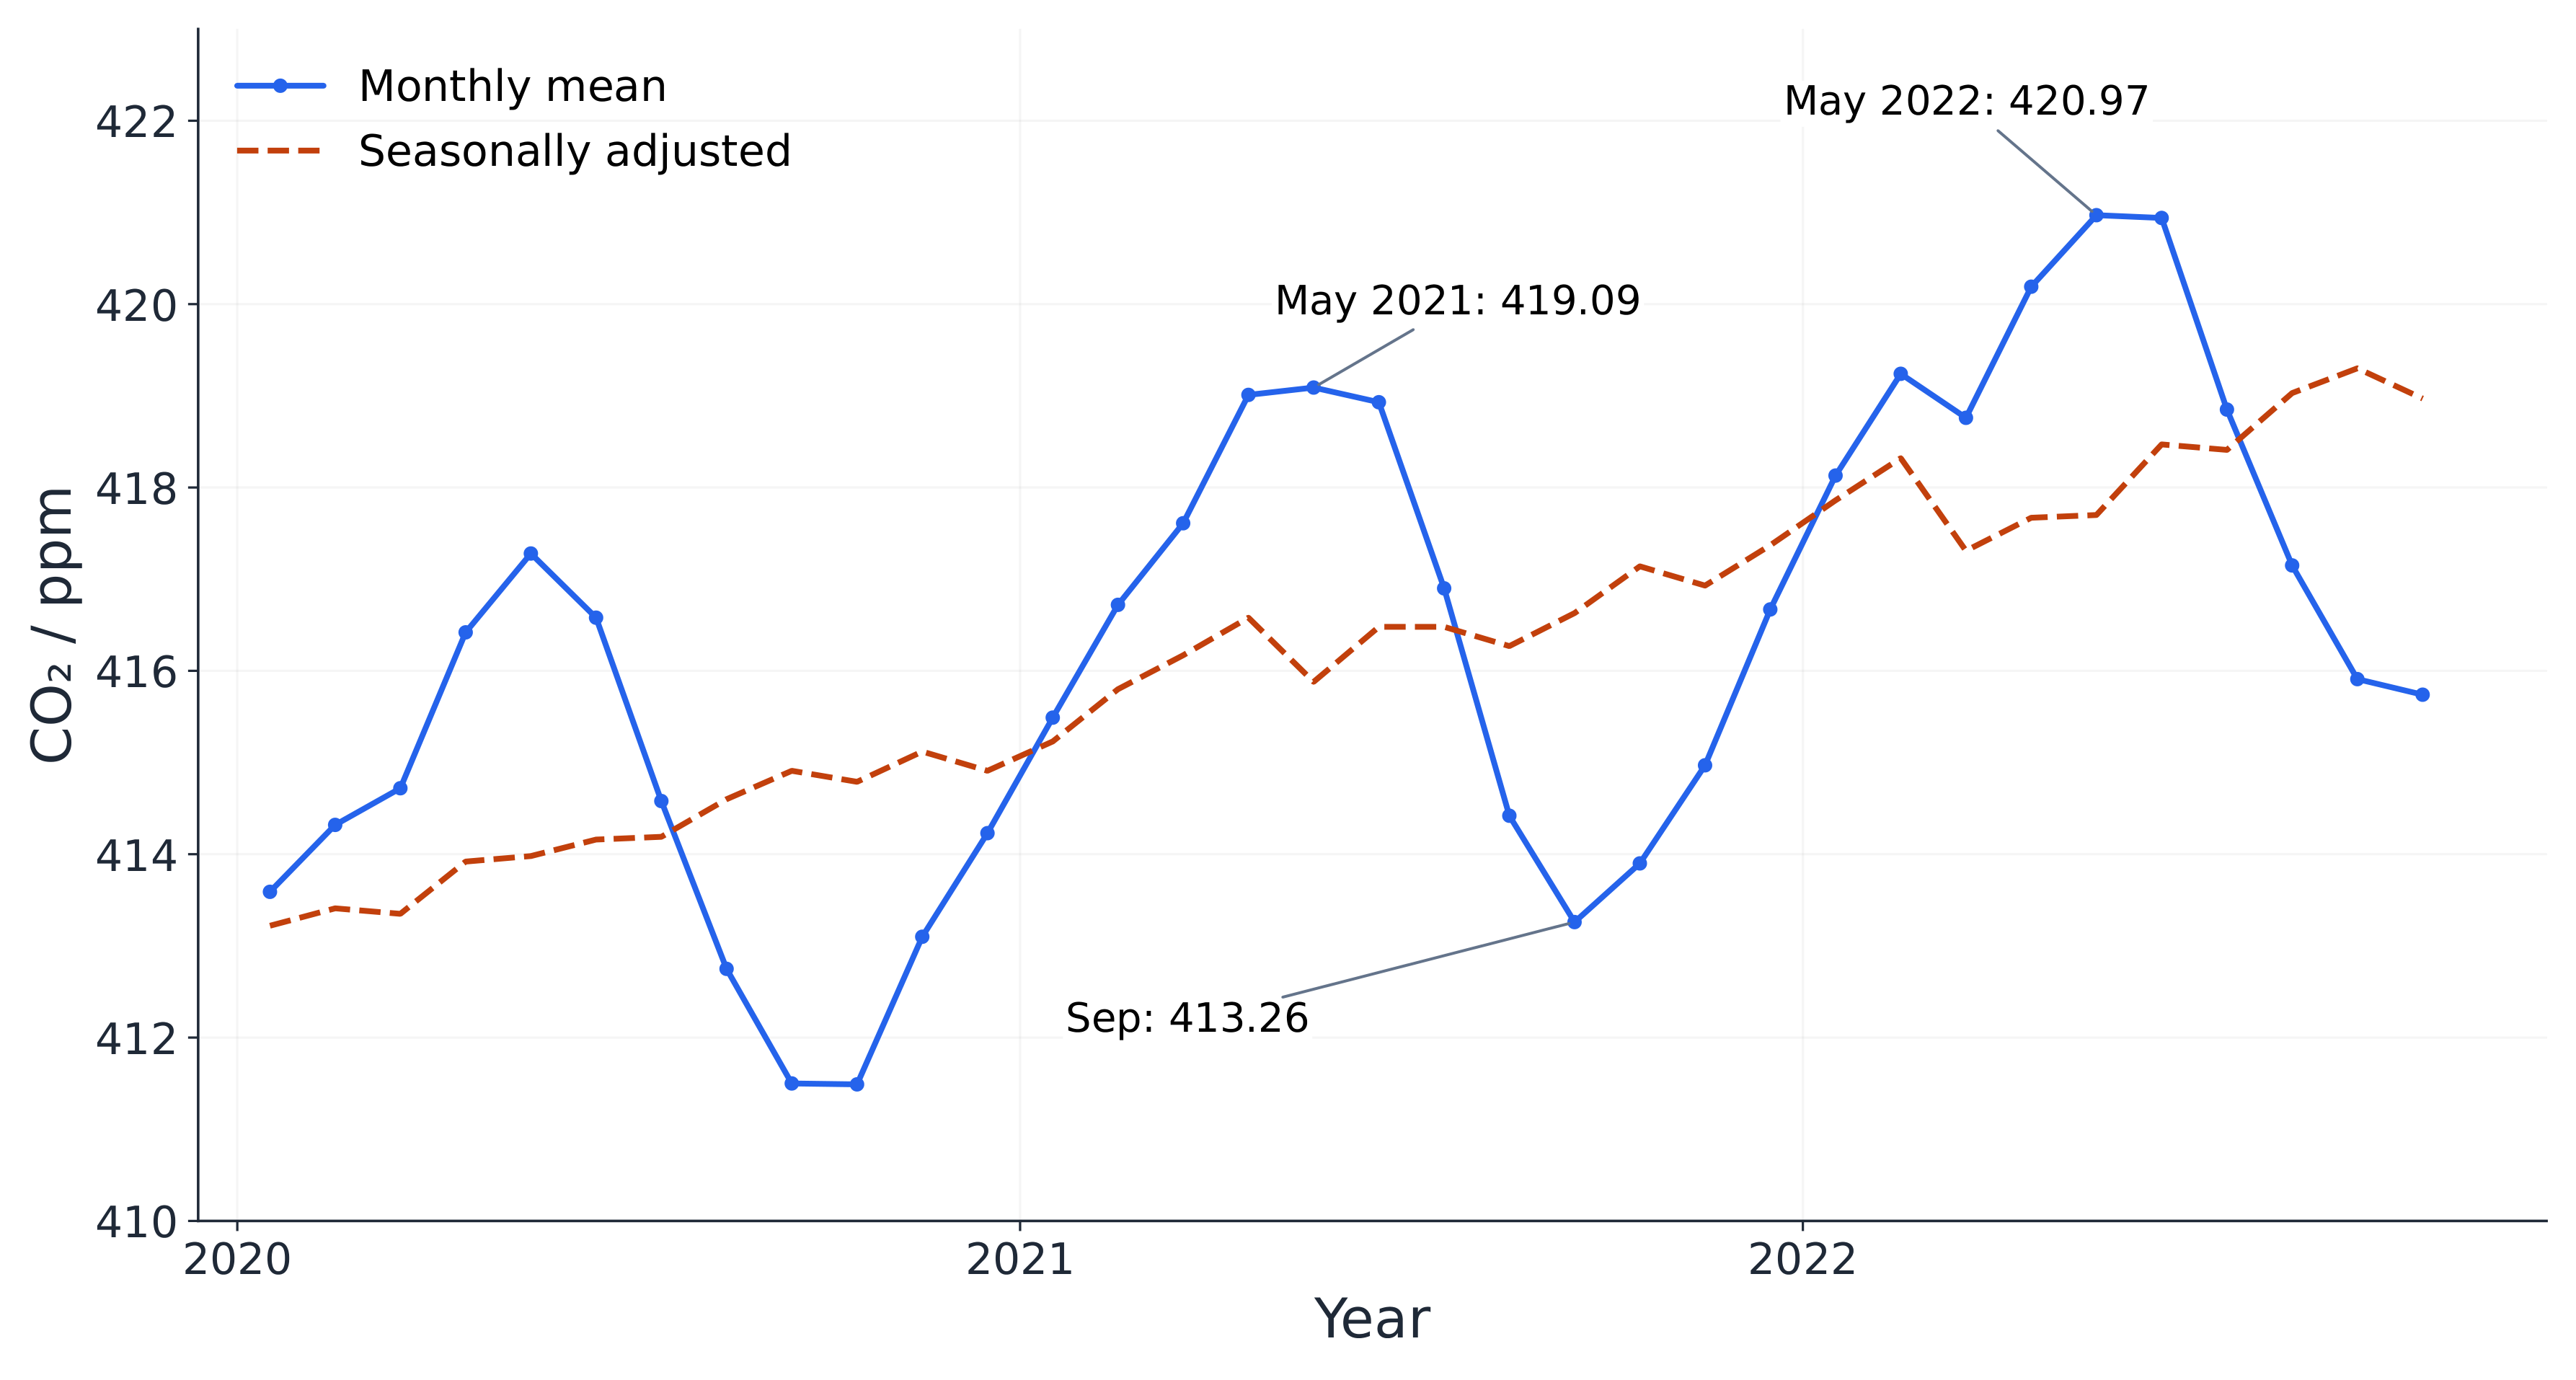
The cited historical NOAA monthly means are 419.09 ppm in May 2021 and 420.97 ppm in May 2022. Find the corresponding-month increase.
Difficulté 2/5 · 140 pièces + un petit bonus lors de la première réussite aujourd'hui
420.97 − 419.09 = 1.88 ppm. Compare the same month to reduce seasonal timing differences; these historical numbers are not a current concentration estimate.
Explain seasonal exchange alongside extra fossil-carbon input
- Northern Hemisphere spring/summer vegetation growth increases carbon uptake, while later reduced photosynthesis and continuing plant/decomposer respiration contribute to the seasonal return. Plants still respire during growth; the balance changes. The hemisphere's extensive land vegetation helps explain the record's strong seasonal influence.
- The long-term rise reflects atmospheric inputs exceeding removals, with fossil-fuel combustion a major driver and land-use change also contributing. A large natural two-way exchange differs from an added net input. Scripps explains fossil-carbon evidence; concentration patterns are evaluated with emissions, isotope and exchange evidence, rather than inferred from shape alone.
Compare conservation principles with useful ecological models
- Energy conservation is a robust physical principle. A fixed 10% trophic-transfer rule is a rough teaching model whose predictions depend on definitions, boundaries and data. Label invented examples, identify assumptions and test the model rather than forcing every measured system to fit.
- Scientific laws describe reproducible patterns and theories explain through mechanisms and evidence; a theory is not merely a guess or a stage waiting to become a law after enough approval. Evaluate the scope and support of a claim, including exceptions and uncertainty, rather than judging it only by its label.
Finish with separate energy and carbon ledgers
- For energy, match production units, area and period; separate ingestion, assimilation, respiration and new biomass, then state each efficiency denominator. Include detrital routes and external support before explaining a pyramid. Energy is transformed and dispersed, not recycled as a chemical element.
- For carbon, draw stores and named transfers, calculate the whole-boundary net change, and distinguish stock from sink/source over an interval. Mineral elements also cycle with inputs and losses, but local recycling need not be complete. Use dated comparable months or an adjusted series to separate seasonal carbon-dioxide change from a long-term trend.
Evaluate these claims: a small producer stock means negligible production; a consumer production/ingestion efficiency is the same as a trophic production transfer; decomposers recycle energy; a seasonal carbon-dioxide fall disproves a long-term rise.
A correct ledger specifies quantities, boundaries, units and time, rather than treating carbon, energy, stocks and flows as interchangeable.