Comparing Categorical Groups
Introduit| English | Sens |
|---|---|
| conditional distributions/kənˈdɪʃənl ˌdɪstrɪˈbjuːʃnz/ | distributions conditionnelles |
| independent/ˌɪndɪˈpendənt/ | indépendant |
| causation/kɔːˈseɪʃn/ | causalité |
| confounding variable/kənˈfaʊndɪŋ ˈveərɪəbl/ | variable confondante |
Comparing groups fairly
- To see if two categorical variables are related, compare conditional distributions 条件分布 across groups.
- A conditional distribution is the set of proportions for one variable within a single group.
- "What does the subject breakdown look like for girls vs for boys?"
- Using proportions (not raw counts) makes the comparison fair when groups differ in size.
Association vs. independence
- If the conditional distributions are the same across groups, the variables appear independent 独立.
- If they differ, the variables show an association — knowing one tells you something about the other.
- The bigger the difference between groups, the stronger the association.
- "Same proportions everywhere" is the picture of no relationship.
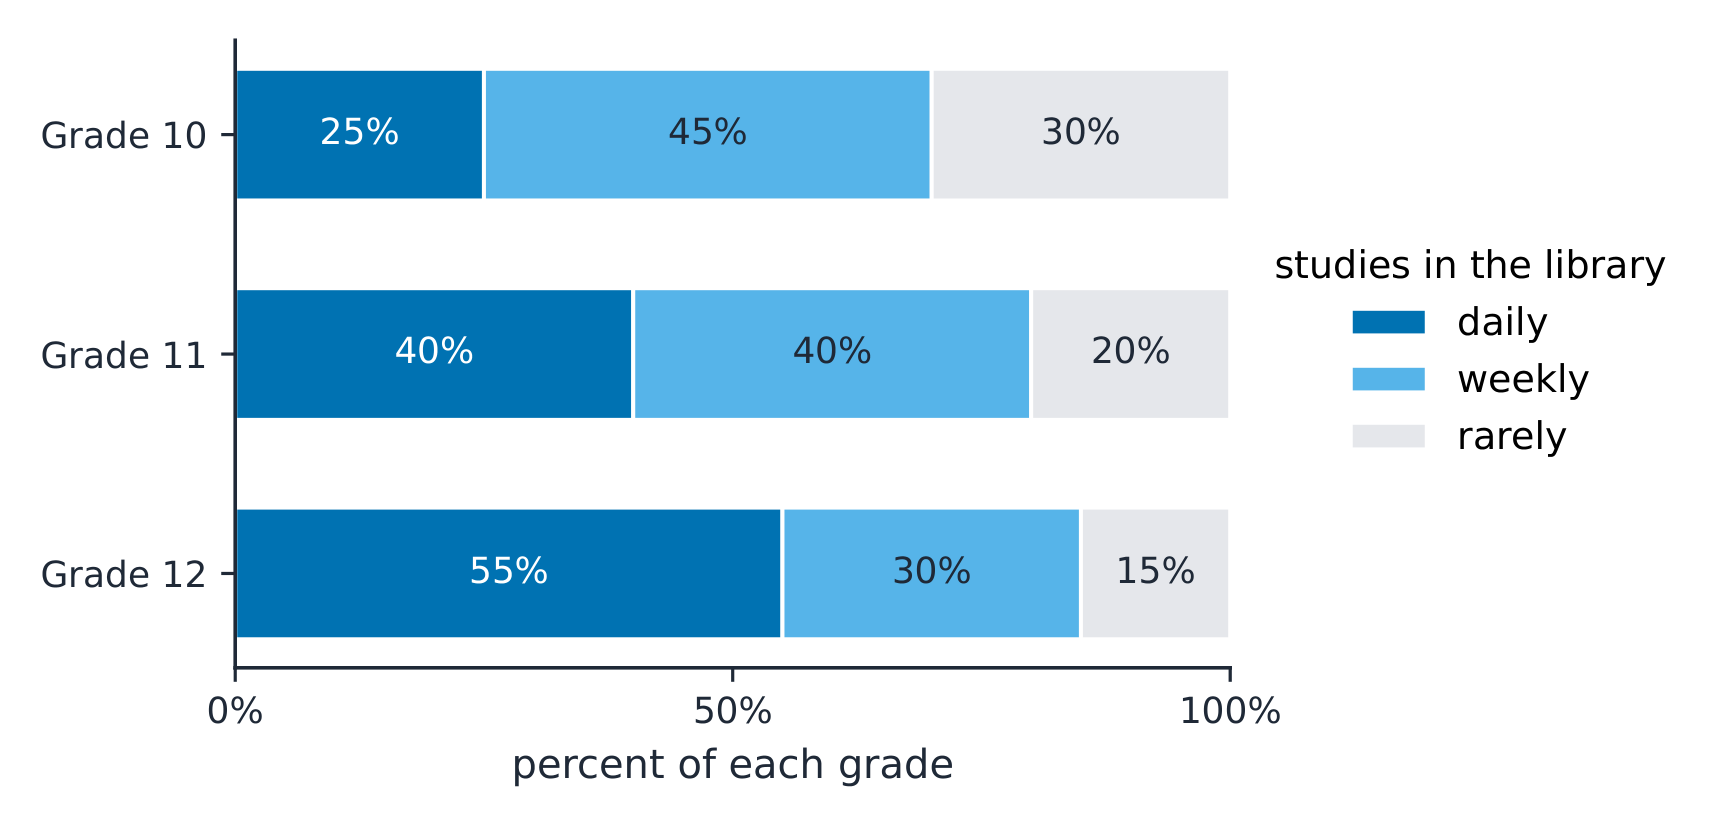
A segmented bar chart compares the conditional distribution in each group
Differences in proportions
- Quantify the association with a difference in proportions: e.g. $60\%$ of girls vs $40\%$ of boys chose science.
- That $20$-percentage-point gap is the evidence of a relationship, stated in context.
- Always report which group is higher and by how much.
- A sample difference may reflect sampling variation; its size and the sample sizes matter when assessing evidence of a population association.
Association is still not causation
- Even a strong association between two categorical variables does not prove causation 因果关系.
- A hidden confounding variable 混杂变量 could drive both.
- Observational data can reveal association but rarely establishes cause.
- Only a well-designed experiment (Unit 3) can support a causal claim.
To judge association, always compare conditional proportions, never raw counts — a group with more people will have bigger counts everywhere even with no relationship. And "$60\%$ vs $40\%$" is an association, not proof that being a girl causes choosing science: a confounding variable could explain the gap.
Do exercise habits relate to sleeping well? Survey results:
- Of exercisers: $70\%$ sleep well. Of non-exercisers: $45\%$ sleep well.
- The conditional distributions differ ($70\%$ vs $45\%$) → an association.
- But maybe healthy people both exercise and sleep well — a confounder. No causation proven.
Compare conditional distributions across groups: if they're the same, the variables look independent; if they differ, there's an association, measured by a difference in proportions (stated in context). Association still does not prove causation — a confounding variable may be at work.
Write from age as a confounder
- A treatment group is mostly older than the comparison group.
- The success rates differ by 15 percentage points, and age can affect success.
A treatment group is mostly older than its comparison group. Success rates differ by 15 percentage points, and age can affect success. Why is the gap hard to attribute to treatment?
A confounder is mixed up with the factor you want to study.
A treatment group is older than its comparison group, and age can affect success. What role does age play?
Difficulté 1/5 · 100 pièces + un petit bonus lors de la première réussite aujourd'hui
Age and treatment changed together.
One group's conditional distribution
Within one group, the slices are its conditional distribution.
Two categorical variables appear independent when their conditional distributions are...
Difficulté 1/5 · 100 pièces + un petit bonus lors de la première réussite aujourd'hui
Same conditional distributions → no association → independence.
70% of exercisers vs 45% of non-exercisers sleep well. What is the difference in proportions, in percentage points?
Difficulté 2/5 · 140 pièces + un petit bonus lors de la première réussite aujourd'hui
70 − 45 = 25 percentage points.
You should compare raw counts, not proportions, to judge association between categorical variables.
Difficulté 1/5 · 100 pièces + un petit bonus lors de la première réussite aujourd'hui
Compare conditional proportions — counts are unfair when groups differ in size.
A hidden variable that could drive both variables and explain an association is a ___ variable.
Difficulté 1/5 · 100 pièces + un petit bonus lors de la première réussite aujourd'hui
A confounding variable offers an alternative explanation.
Which statements about association vs. causation are correct?
Difficulté 2/5 · 140 pièces + un petit bonus lors de la première réussite aujourd'hui
Even strong association never by itself proves causation.