Diversity, classification and a branching model
Introducido| English | Significado |
|---|---|
| taxon/ˈtæksn/ | taxón |
| clade/kleɪd/ | clado |
What would explain this observation?
- Two species look similar but their DNA comparison places them in different branches. Classification uses several kinds of evidence rather than appearance alone.
Build the model
- A species is a biological grouping; a taxon 分类群 is a named classification group.
- A cladogram represents a hypothesis of relationships based on shared derived characteristics or molecular evidence.
- A branch point represents a common ancestor, not an individual alive today.
- taxon: A named group in a classification.
- clade 演化支: A common ancestor and all its descendants.

What remains the same when branches rotate around a node?
Dificultad 1/5 · 100 monedas + un pequeño bono en el primer intento de hoy
Rotating branches at a node changes only the drawing order; the branching pattern - which groups share which ancestors - is untouched. Tip order on the page is not a sequence of progress or time.
Match each technical term to its precise meaning.
Dificultad 2/5 · 140 monedas + un pequeño bono en el primer intento de hoy
Use the definitions to distinguish related quantities and processes.
Choose evidence that can test it
- Read relationships from the branching order.
- Rotating branches at a node does not change ancestry.
- A branch length represents time or change only when the diagram gives a scale.
In the lab: Record character states in a matrix before drawing a tree. Define which state is ancestral using an appropriate comparison. Test whether a new molecular dataset supports the same grouping.
Rotate branches, keep the same ancestry
Tip order can change without changing the tree. Trace a selected pair to its most recent common ancestor, then include every descendant to identify the whole clade.
Which two habits make the investigation or model in this case more defensible?
Dificultad 2/5 · 140 monedas + un pequeño bono en el primer intento de hoy
Stating the conditions and assumptions lets others repeat the work exactly, and recording the supporting evidence lets them check the conclusion. Hiding disagreeing results removes the evidence that could challenge a wrong conclusion, and one measurement can never establish a wider claim.
Work from known quantities
- Known: an alignment contains 40 sites, with 6 differences.
- Difference proportion = 6/40 = 0.15, or 15%.
- This is an observed comparison, not a calibrated molecular clock unless rate assumptions and corrections are supplied.
Your turn: There are 8 differences in 50 aligned sites. Calculate percentage difference.
There are 8 differences in 50 aligned sites. Calculate percentage difference.
Dificultad 2/5 · 140 monedas + un pequeño bono en el primer intento de hoy
The result is 16 %. Known: 8 differences in 50 aligned sites. Use percentage difference = differences / sites x 100. Difference = 8/50 x 100 = 16%. This observed percentage is not a molecular-clock estimate without rate assumptions.
Check the conclusion and its limits
- A modern species is not automatically the ancestor of another modern species.
- Similarity caused by convergent evolution can mislead a classification based on one trait.
Not true: Every cladogram branch length is a measurement of elapsed time. Branch lengths represent time only when a time scale is stated. A change scale measures evolutionary change rather than elapsed time. Many cladograms encode relationships only, with arbitrary lengths.
- A species is a biological grouping; a taxon is a named classification group.
- Read relationships from the branching order.
- Watch for: A modern species is not automatically the ancestor of another modern species.
Branch lengths represent time only when a time scale is stated.
Dificultad 1/5 · 100 monedas + un pequeño bono en el primer intento de hoy
True. Branch lengths represent time only when a time scale is stated. A change scale measures evolutionary change rather than elapsed time. Many cladograms encode relationships only, with arbitrary lengths.
A named group in a classification: write the technical term.
Dificultad 1/5 · 100 monedas + un pequeño bono en el primer intento de hoy
taxon means A named group in a classification.
There are 11 differences in 50 aligned sites. What is the percentage difference, and when does a branch length mean elapsed time?
Percentage difference = differing sites / aligned sites × 100 = 11/50 × 100 = 22%. Branch length means elapsed time only when the tree explicitly supplies a time scale.
The SL written case has 11 differences in 50 aligned sites. What is the percentage difference?
Dificultad 1/5 · 100 monedas + un pequeño bono en el primer intento de hoy
11/50 × 100 = 22%. A branch length represents time only when the tree has an explicit time scale; an unscaled length need not represent elapsed time.
Write from a sequence difference with a declared comparison
- In the SL written case, 11 differences among 50 aligned sites gives $11/50\times100=22\%$ difference. Rotating branches at a node changes the drawing's page order, not the inferred ancestry. The earlier examples, 6 differences in 40 sites and 8 in 50, give 15% and 16% respectively; each result belongs to its own alignment.
- This route develops A3.1 Diversity of organisms through species concepts, chromosome comparisons, genomes and evidence. New numerical datasets and schematic chromosomes are invented. State the kind of evidence and the quantity being compared: a visible trait, chromosome count, amount of DNA, sequence difference and reproductive relationship answer different questions.
Distinguish variation from a species boundary
- Individuals vary through inherited differences, environment and development. Leaf size may change with light, water, age and genotype, so one size difference does not establish a different species. A morphological species concept uses shared structural features, preferably several stable diagnostic characters. It is useful for identification and fossils, where breeding evidence may be unavailable.
- Appearance also has limits: life stages and sexes can differ within one species, while separate species can look very similar. Convergent evolution can give unrelated groups similar features. Record the character, measurement method and biological context before deciding what the difference means. A consistent observation is stronger than an unexplained impression that two organisms “look different”.
Apply the biological species concept to populations
- Under the biological species concept, species comprise populations whose members can interbreed and produce viable, fertile offspring, with reproductive isolation from other such groups. It concerns potential gene flow among populations. It does not require every individual to mate with every other: age, sex and temporary separation do not independently determine species membership.
- In an invented case, two colour forms regularly produce fertile offspring under natural conditions. Colour alone is weak evidence for splitting them into separate biological species. Conversely, similar-looking populations with consistent reproductive barriers may represent distinct groups. State the concept being applied rather than treating morphology and reproductive compatibility as interchangeable tests.
Write a precise scientific name
- A binomial combines a genus name and a specific epithet. Write Homo sapiens with a capital genus, lowercase epithet and both words italicized; underline the two parts separately in handwriting. After giving the complete name, H. sapiens may be used when unambiguous. The epithet alone does not identify the complete species name.
- Pan troglodytes and Pan paniscus share a genus while representing different species. Common names vary between regions and languages, so a recorded scientific name helps another investigator repeat a database search or field comparison. A taxon is a named classification group; a clade comprises an ancestor and all its descendants. Naming and inferring ancestry are linked but distinct tasks.
Explain how speciation can produce intermediate cases
- Reduced gene flow allows populations to diverge through mutation, selection and other population processes. Differences in breeding time, mating signals or compatibility can emerge gradually. Boundaries may therefore be partly developed rather than perfectly absent or complete at every stage. A scientific classification must explain which concept and evidence support its decision.
- A genetic difference alone does not establish complete reproductive isolation; occasional hybridization also does not automatically make all populations one species. Compare several characters, fertility and patterns of gene flow in context. Observed sequence difference is not a universal species threshold, and two modern species are not automatically in a direct ancestor–descendant relationship.
Keep chromosome, chromatid and DNA-amount counts separate
- Typical human diploid body cells have 46 chromosomes, or 23 pairs; human gametes normally have 23. Chimpanzee diploid cells typically have 48, or 24 pairs. The counts describe how DNA is organized, not a ranking of complexity. Homologous chromosomes carry corresponding genes and can have different alleles; sister chromatids are the copied products of one chromosome.
- Count chromosomes by centromeres in the standard model. After DNA replication but before chromatid separation, a human cell still has 46 chromosomes, now with 92 sister chromatids in total. DNA amount has doubled, while chromosome count at that stage has not. A new cell-stage description can change the relevant count, so state the stage before applying the rule.
A typical human diploid cell has 46 chromosomes. After DNA replication, before sister chromatids separate, how many chromatids does it contain?
Dificultad 2/5 · 140 monedas + un pequeño bono en el primer intento de hoy
Each of the 46 chromosomes has two sister chromatids, giving 92 chromatids. At this specified stage, chromosome number remains 46 while DNA amount has doubled.
Construct and interpret a karyogram
- A karyogram arranges chromosomes into matching groups using relative length, centromere position and banding pattern. The karyotype describes the complement's number and appearance. Orientation may be reversed in a photograph, and length alone is insufficient. The analyst's arrangement of homologues does not mean every photographed homologue was physically paired along its length.
- The diagram shows four pairs, or eight chromosomes. A separate invented complement contains three pairs: $2n=6$, with $n=3$ in a normal haploid set. After replication but before chromatid separation, it still contains six chromosomes and has twelve chromatids. A third copy of one type should be identified rather than forced into pairs. A karyogram can reveal large changes but normally cannot resolve a single-base substitution.
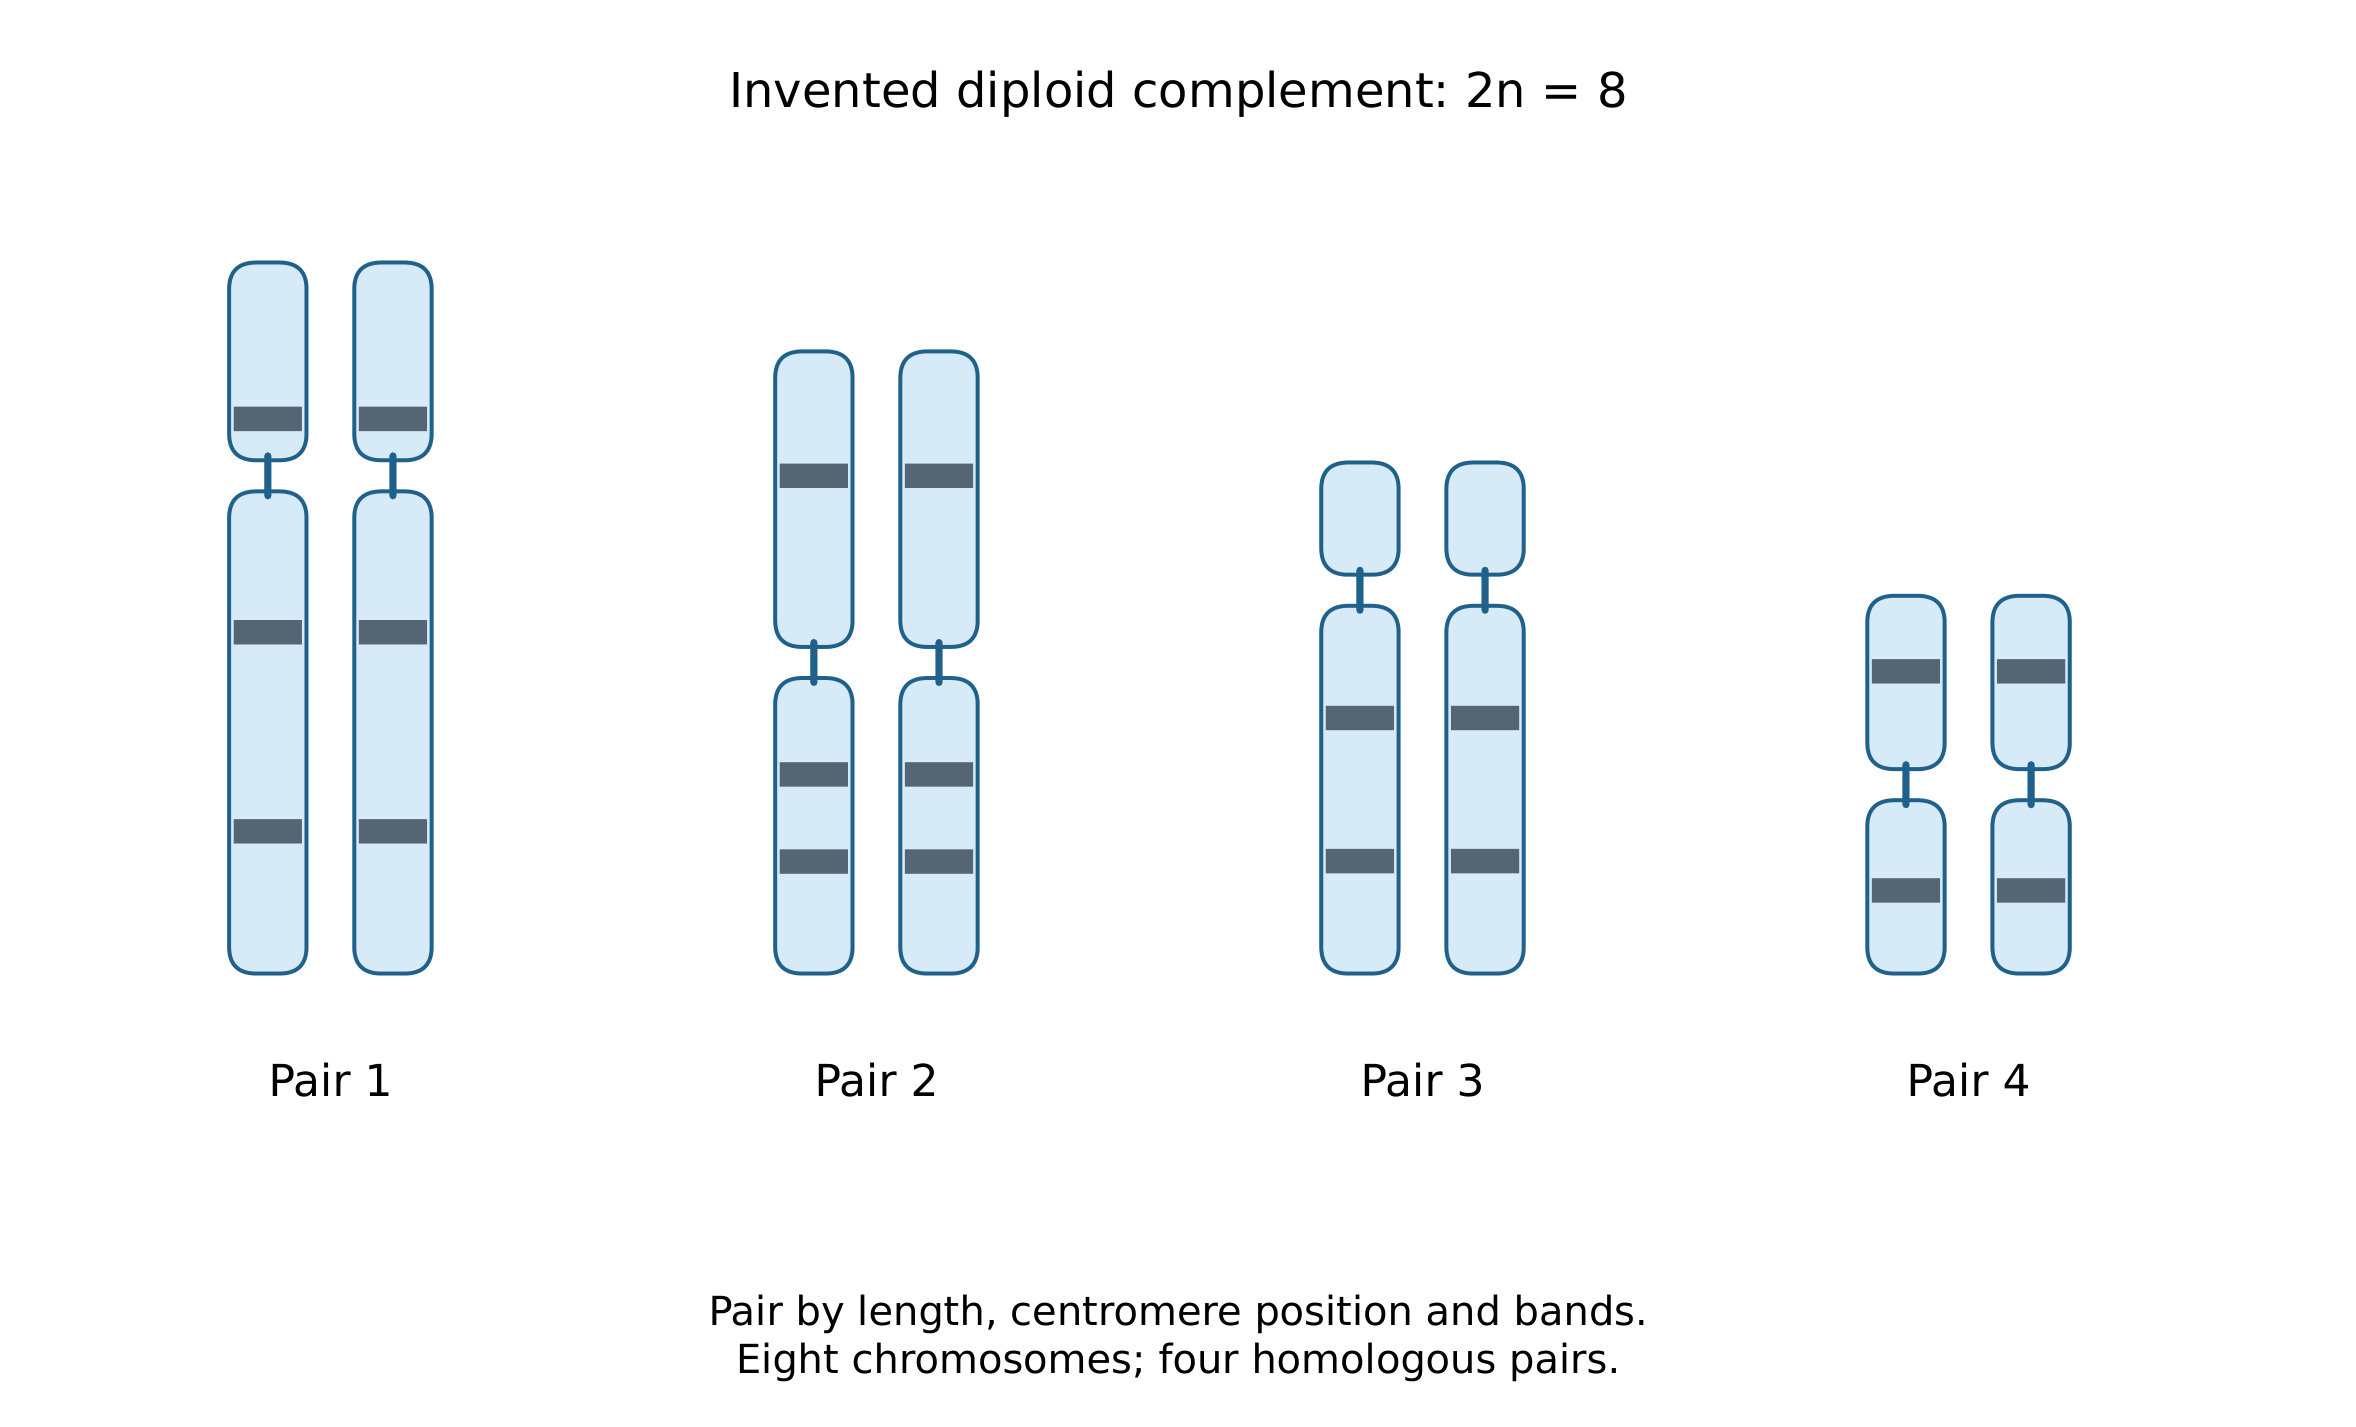
An invented diploid complement has three homologous chromosome pairs. How many chromosomes are present before chromatid separation, whether or not DNA has already replicated?
Dificultad 2/5 · 140 monedas + un pequeño bono en el primer intento de hoy
Three pairs give 2n = 6. After replication but before chromatid separation, these are still six chromosomes, now with twelve chromatids.
Test the chromosome-fusion hypothesis with structural predictions
- If two ancestral chromosome types fused in the human lineage, their corresponding sequence blocks should occur joined on human chromosome 2. Evidence includes block correspondence and internal oppositely oriented telomere-like repeats near the inferred joining region. The primary fusion study reports this internal telomere-repeat evidence; comparison of chromosome numbers alone would not identify the mechanism.
- A fusion model involving both homologous sets changes two chromosome pairs into one pair, reducing the diploid count by two while retaining much sequence. It does not imply loss of half the genome or a modern chimpanzee becoming human. Modern humans and chimpanzees share ancestry; the inference concerns changes along lineages. Additional chromosome structure and comparative evidence constrain the explanation.
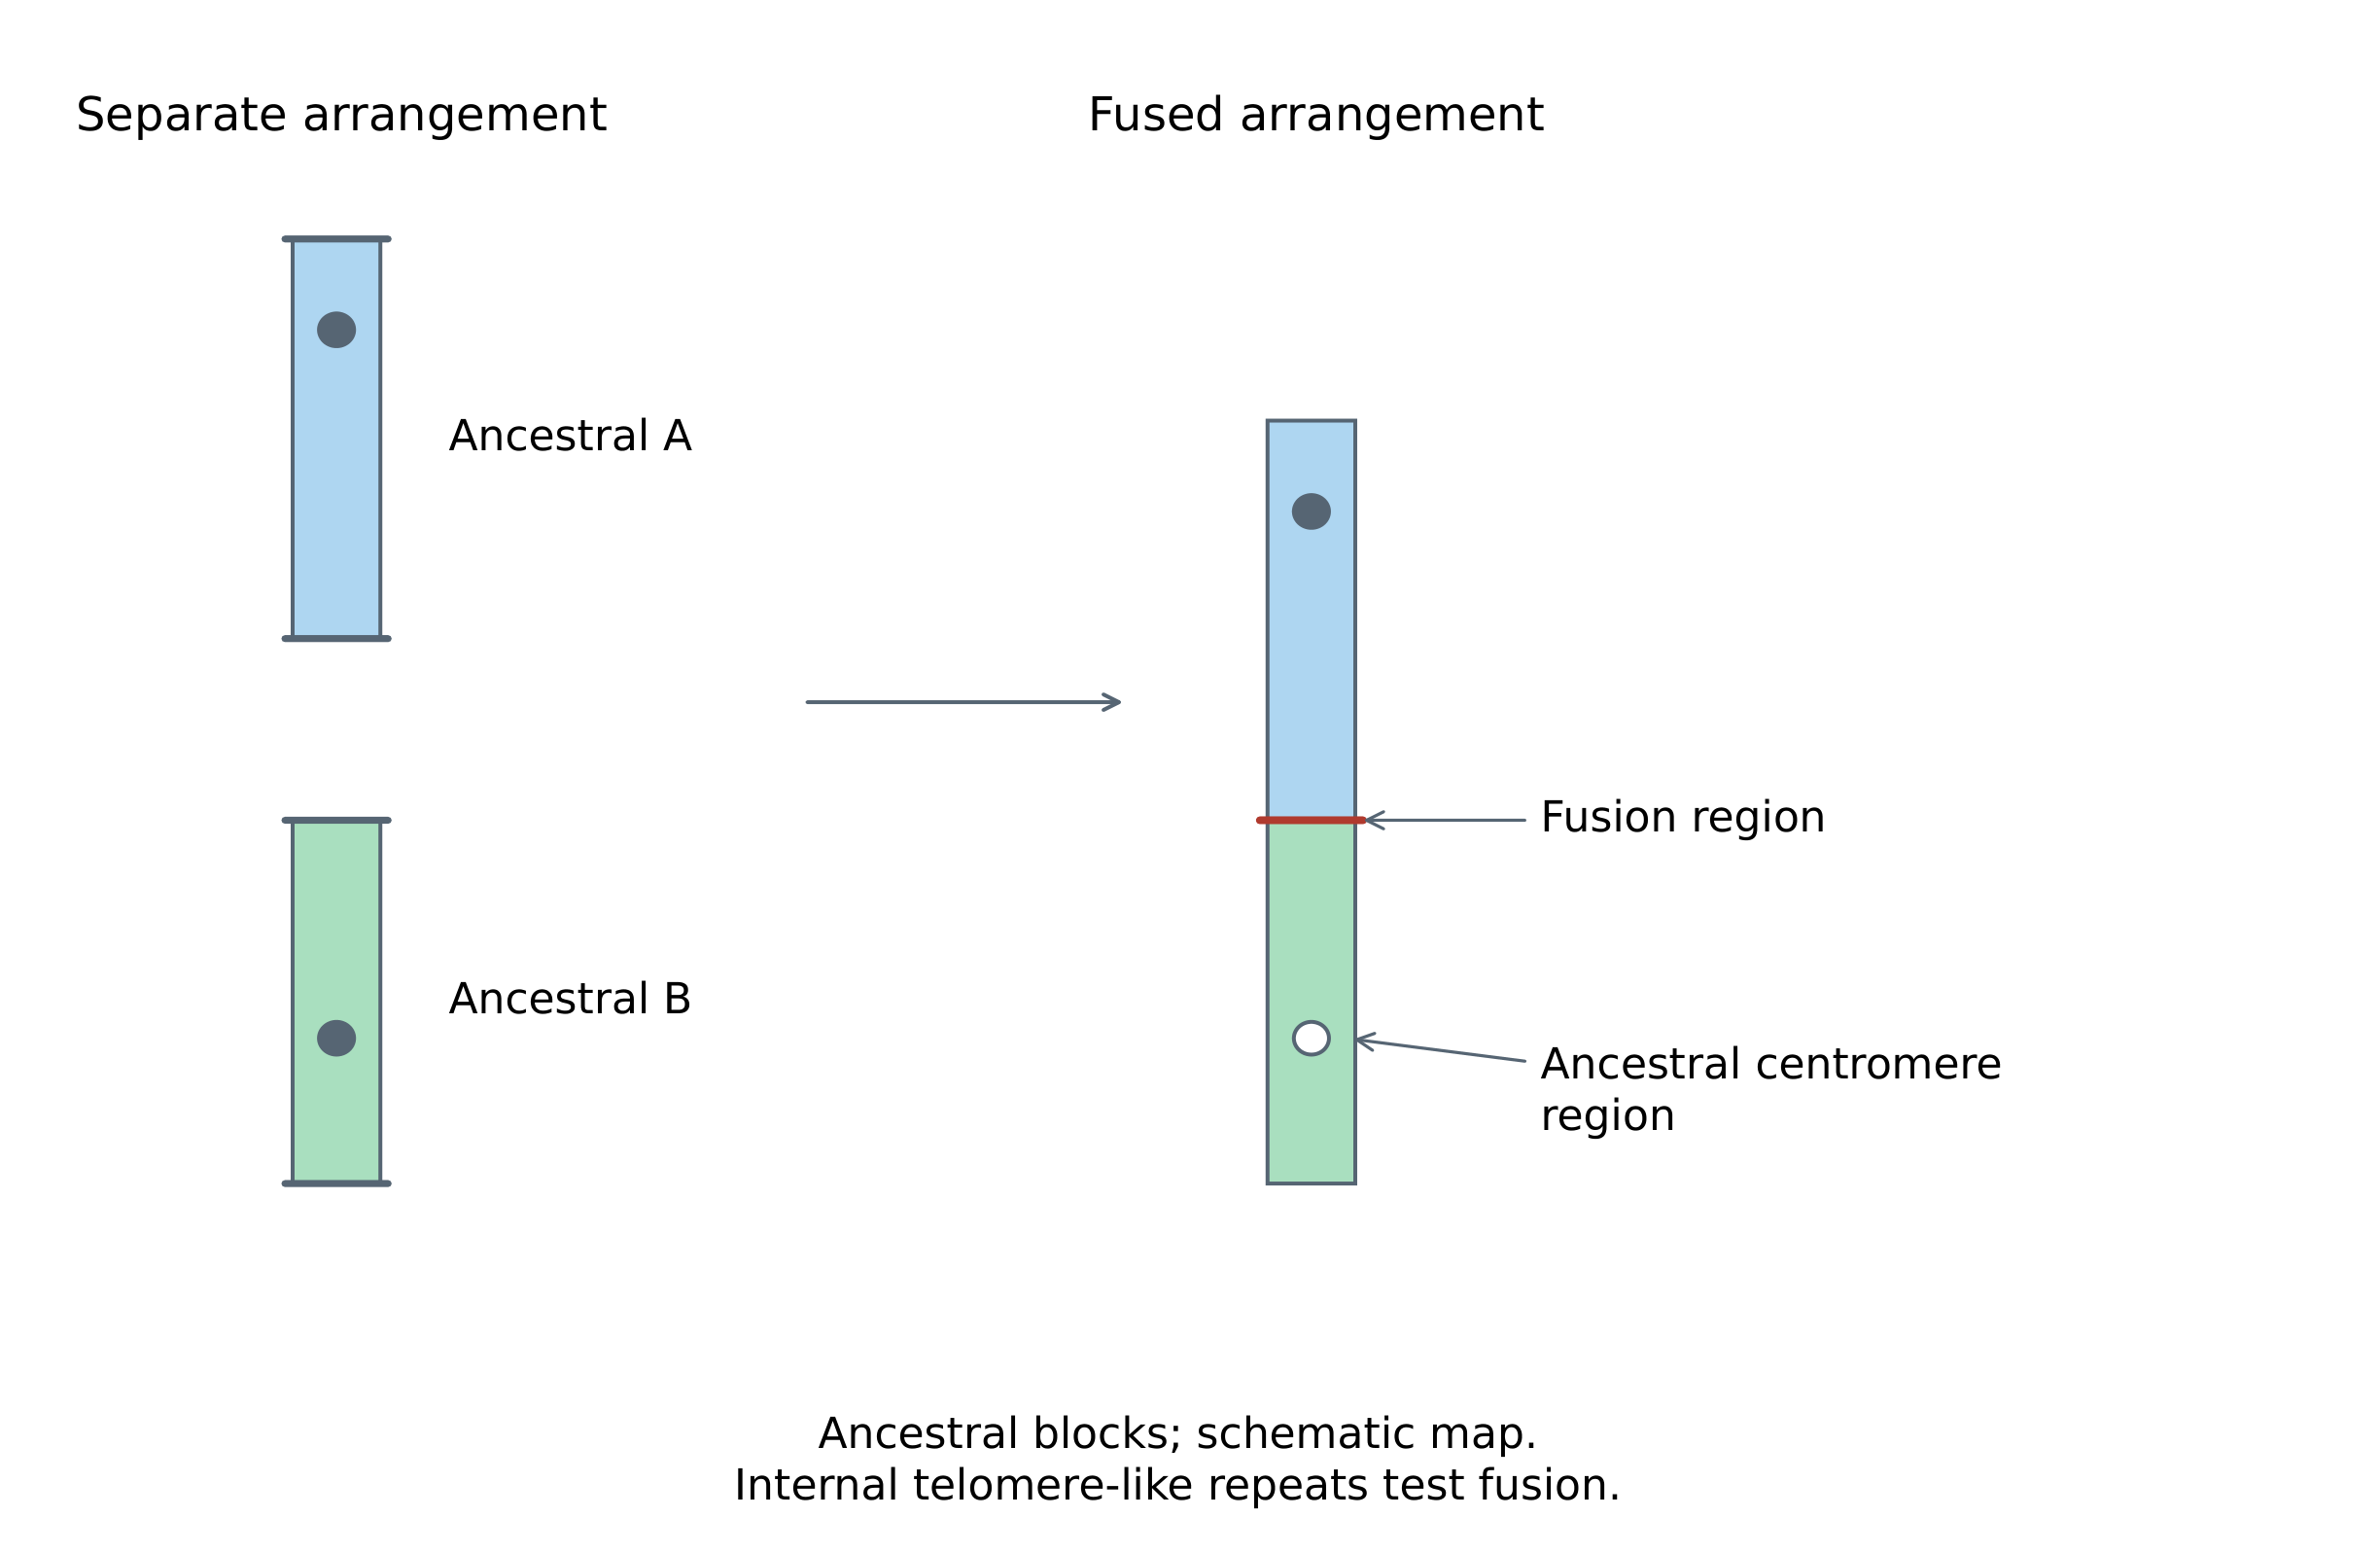
Which observation would specifically support an ancestral chromosome-fusion hypothesis?
Dificultad 1/5 · 100 monedas + un pequeño bono en el primer intento de hoy
Fusion predicts structural correspondence and evidence near a joined region. Count differences alone do not identify the mechanism, and modern humans and chimpanzees share ancestry rather than one modern species becoming the other.
Define the genome and the variation being measured
- A genome includes an organism's complete genetic information, with coding and non-coding regions. For a eukaryotic comparison, specify whether the quantity is nuclear DNA or also includes mitochondrial or chloroplast DNA. A single-nucleotide polymorphism is variation at a particular nucleotide position in a population; a diploid individual may carry identical or different alleles at that site.
- A sequence variant can occur outside a coding region, change a codon without changing its amino acid, or have an effect depending on biological context. Sequence difference, chromosome number, gene number and genome size are separate quantities. A percentage without its denominator and comparison method is incomplete; one aligned region need not summarize every part of the genome.
Compare DNA amounts on the same ploidy basis
- In an invented comparison, a plant's haploid nuclear DNA amount is 150 million base pairs and an animal's is 3000 million on the same basis. The ratio is $3000/150=20$. This means twenty times the stated DNA amount, not twenty times the complexity, gene number or chromosome number. Repeated and other non-coding sequences contribute to genome-size differences.
- If the plant's reported value were instead 300 million base pairs per diploid cell, its haploid equivalent would be $300/2=150$ million. Dividing 3000 by 300 would mix different bases of comparison and give a misleading ratio of ten. Record whether “base pairs” describes an assembly, a haploid complement or total cellular DNA before calculating.
Invented nuclear DNA amounts are 300 million base pairs per diploid plant cell and 3000 million per haploid animal complement. Find the animal-to-plant ratio after converting both to a haploid basis.
Dificultad 2/5 · 140 monedas + un pequeño bono en el primer intento de hoy
The plant haploid equivalent is 300/2 = 150 million. Ratio is 3000/150 = 20. This DNA-amount ratio does not establish a gene-number or complexity ratio.
Make a genome-database comparison reproducible
- Record organism/strain, accession/version, assembly name, component set and statistic. “Total length” includes gaps; “ungapped length” excludes them. For human GCF_000001405.40, the primary-assembly total is 3,099,441,038 bp; including all listed assembly units gives 3,298,430,636 bp. These totals describe different reference components, rather than different numbers of chromosome sets in one person.
- Compare the same component set across organisms. Primary-assembly totals exclude separately listed organellar and alternate/patch units. A human primary reference can contain both X and Y sequence types, so counting its chromosome sequence types does not give the 46 chromosomes of an ordinary diploid body cell. Incomplete assemblies can also miss DNA; more assembled sequence does not establish greater complexity.
Separate whole-genome sequencing from interpretation
- Whole-genome sequencing aims to determine sequence across a genome rather than only a short marker. Reads must be checked, assembled or aligned and then interpreted. It can support variant discovery, evolutionary comparisons, pathogen investigations and crop research. Multiple genomic regions can test whether a relationship inferred from one gene is consistent more widely.
- Sequence data do not automatically reveal every variant's effect or precisely predict an individual's future. Development, environment and other biological interactions matter, and some findings remain uncertain. A medical interpretation also needs clinical context rather than a sequence-only diagnosis. Privacy, consent and appropriate handling of personal information remain relevant when human genomes are studied.
Read a cladogram from nodes rather than page order
- A branch point represents inferred common ancestry. Two tips sharing a more recent common ancestor with each other than with another tip are more closely related in that tree. Rotating daughter branches around a node preserves these relationships, even if neighbouring names on the page change. A modern tip is not automatically another tip's ancestor.
- Unscaled branch length does not measure elapsed time. Some trees explicitly scale branch lengths by time or inferred change; read that scale before interpreting length. Similarity caused by convergence can mislead a tree based on one trait, while different genomic regions may have different histories. Compare independent evidence and state what kind of relationship the diagram proposes.
Match the conclusion to the available evidence
- A species name, reproductive test, karyogram, genome-size estimate and sequence comparison each contribute a different kind of information. Explain their connection rather than substituting one for another. For a historical hypothesis, identify a testable prediction and observations that support it; for a numerical comparison, declare the quantity, units and denominator.
- If evidence disagrees, examine the species concept, sampling, alignment and biological history before treating one convenient measurement as decisive. A different chromosome number alone is not a universal species test, and a close sequence match is not a calibrated evolutionary date. A useful conclusion states both what the evidence supports and which further comparison would resolve a remaining uncertainty.
Two populations look similar but differ at one DNA region. Evaluate whether this is enough to identify them as separate biological species or to date their divergence.
Match the claim to the species concept and the kind of evidence, then identify the additional comparisons needed.