Gene expression: regulate products, not just genes
Introducido| English | Significado |
|---|---|
| gene expression/dʒiːn ekˈspreʃn/ | The use of information in a gene to produce a functional RNA molecule or protein. |
| transcription factor/trænˈskrɪpʃn ˈfæktə/ | factor de transcripción |
| epigenetic modifications | chemical changes to DNA or its histone proteins, such as methylation, that change gene expression without changing the base sequence |
A bacterium that switches a gene on, 1961
- In 1961 François Jacob and Jacques Monod in Paris explained why the bacterium E. coli makes the enzyme that digests lactose only when lactose is present. A repressor protein normally blocks the gene; lactose removes the block. They shared the 1965 Nobel Prize.
- Your neurons and liver cells carry the same genome, yet make very different proteins. Gene expression 基因表达 — which genes are used, when and how much — is regulated.
Build the model
- Expression can be regulated at transcription, at mRNA processing and breakdown, at translation and after translation.
- A transcription factor 转录因子 is a protein that binds DNA or other proteins to raise or lower transcription. Epigenetic modifications 表观遗传修饰 — such as DNA methylation or histone acetylation — change expression without changing the DNA base sequence.

What is justified by higher measured mRNA abundance?
Dificultad 1/5 · 100 monedas + un pequeño bono en el primer intento de hoy
Higher mRNA abundance shows more of that transcript under the measured conditions. Greater synthesis, slower RNA removal or both can explain it. Protein level also depends on translation and degradation. This RNA measurement alone does not establish whether the DNA sequence changed; a mutation affecting regulation is one possible explanation to test, rather than a conclusion from RNA amount alone.
Match each technical term to its precise meaning.
Dificultad 2/5 · 140 monedas + un pequeño bono en el primer intento de hoy
Use the definitions to distinguish related quantities and processes.
Choose evidence that can test it
- More mRNA is not automatically more active protein: translation, protein breakdown and modification all intervene, so measure the level you make claims about.
- Jacob and Monod used mutants: bacteria with a broken repressor made the enzyme all the time, even without lactose — a perturbation that tested the model, not just a correlation.
In the lab: compare treated and control expression data only after checking normalisation and replicates. Use a perturbation — a mutant, a knock-down, an added hormone — to test a causal model, rather than treating every association as a direct mechanism.
Which two habits make the investigation or model in this case more defensible?
Dificultad 2/5 · 140 monedas + un pequeño bono en el primer intento de hoy
Stating the conditions and assumptions lets others repeat the work exactly, and recording the supporting evidence lets them check the conclusion. Hiding disagreeing results removes the evidence that could challenge a wrong conclusion, and one measurement can never establish a wider claim.
Work from known quantities
- Known: normalised transcript abundance is 12 in the treatment and 3 in the control.
- Fold change = $\frac{12}{3} = 4$: the treatment has four times the transcript level. Equal normalised abundance does not require equal raw cell counts in the two samples.
Your turn: transcript abundance is 15 in the treatment and 5 in the control. Find the fold change. ($\frac{15}{5} = 3$.)
A fourfold mRNA change does not specify the protein change
Reproduce the lesson's 12/3 = 4 transcript fold change. Compare added fictional protein readings of 6 and 6, then vary the independent measurements to distinguish mRNA abundance, total protein abundance and unmeasured protein activity.
Transcript abundance is 15 in treatment and 5 in control. Find fold change.
Dificultad 2/5 · 140 monedas + un pequeño bono en el primer intento de hoy
The result is 3 . Known: abundance 15 in treatment, 5 in control. Use fold change = treatment / control. Fold change = 15/5 = 3. Normalized abundance can be compared without equal raw cell counts.
Check the conclusion and its limits
- An epigenetic change is not a DNA-sequence mutation, and an mRNA change is not proof of a protein change.
- Regulation depends on cell type and environment: the lac genes are off in glucose with no lactose and on with lactose — the same genome, different expression.
Not true: every change in gene expression is a mutation. Expression can change without any change in DNA sequence, through transcription factors, epigenetic marks or altered mRNA lifetime. A mutation in a promoter can also change expression, so an RNA difference alone neither proves nor rules out a mutation — compare sequence evidence and test the mechanism.
- Gene expression is regulated at transcription and at later stages, by transcription factors and epigenetic marks.
- Measure the level you make claims about: mRNA is not protein. Test causal models with perturbations such as mutants.
- An epigenetic change is not a DNA-sequence mutation.
Every change in gene expression is a mutation.
Dificultad 1/5 · 100 monedas + un pequeño bono en el primer intento de hoy
Gene expression can change without a DNA-sequence change, through transcriptional regulation or altered RNA persistence. A mutation in a promoter or another regulatory sequence can also alter expression. An RNA abundance difference alone therefore neither proves nor excludes a mutation; compare sequence evidence and test the proposed mechanism.
A protein that influences transcription: write the technical term.
Dificultad 1/5 · 100 monedas + un pequeño bono en el primer intento de hoy
transcription factor means A protein that influences transcription.
Write from the data: find the transcript fold change
- Normalized transcript abundance is 20 in the treatment and 4 in the control.
- Find the fold change. An mRNA change is not automatically a protein change.
Normalized transcript abundance is 20 in the treatment and 4 in the control. What is the fold change, and why might the protein change be different?
20 divided by 4 is 5. The transcript measurement stops before those later steps.
The written case has normalized transcript abundance 20 in treatment and 4 in control. What is treatment/control fold change?
Dificultad 1/5 · 100 monedas + un pequeño bono en el primer intento de hoy
20 divided by 4 is 5.
AHL: Compare genome, transcriptome and proteome
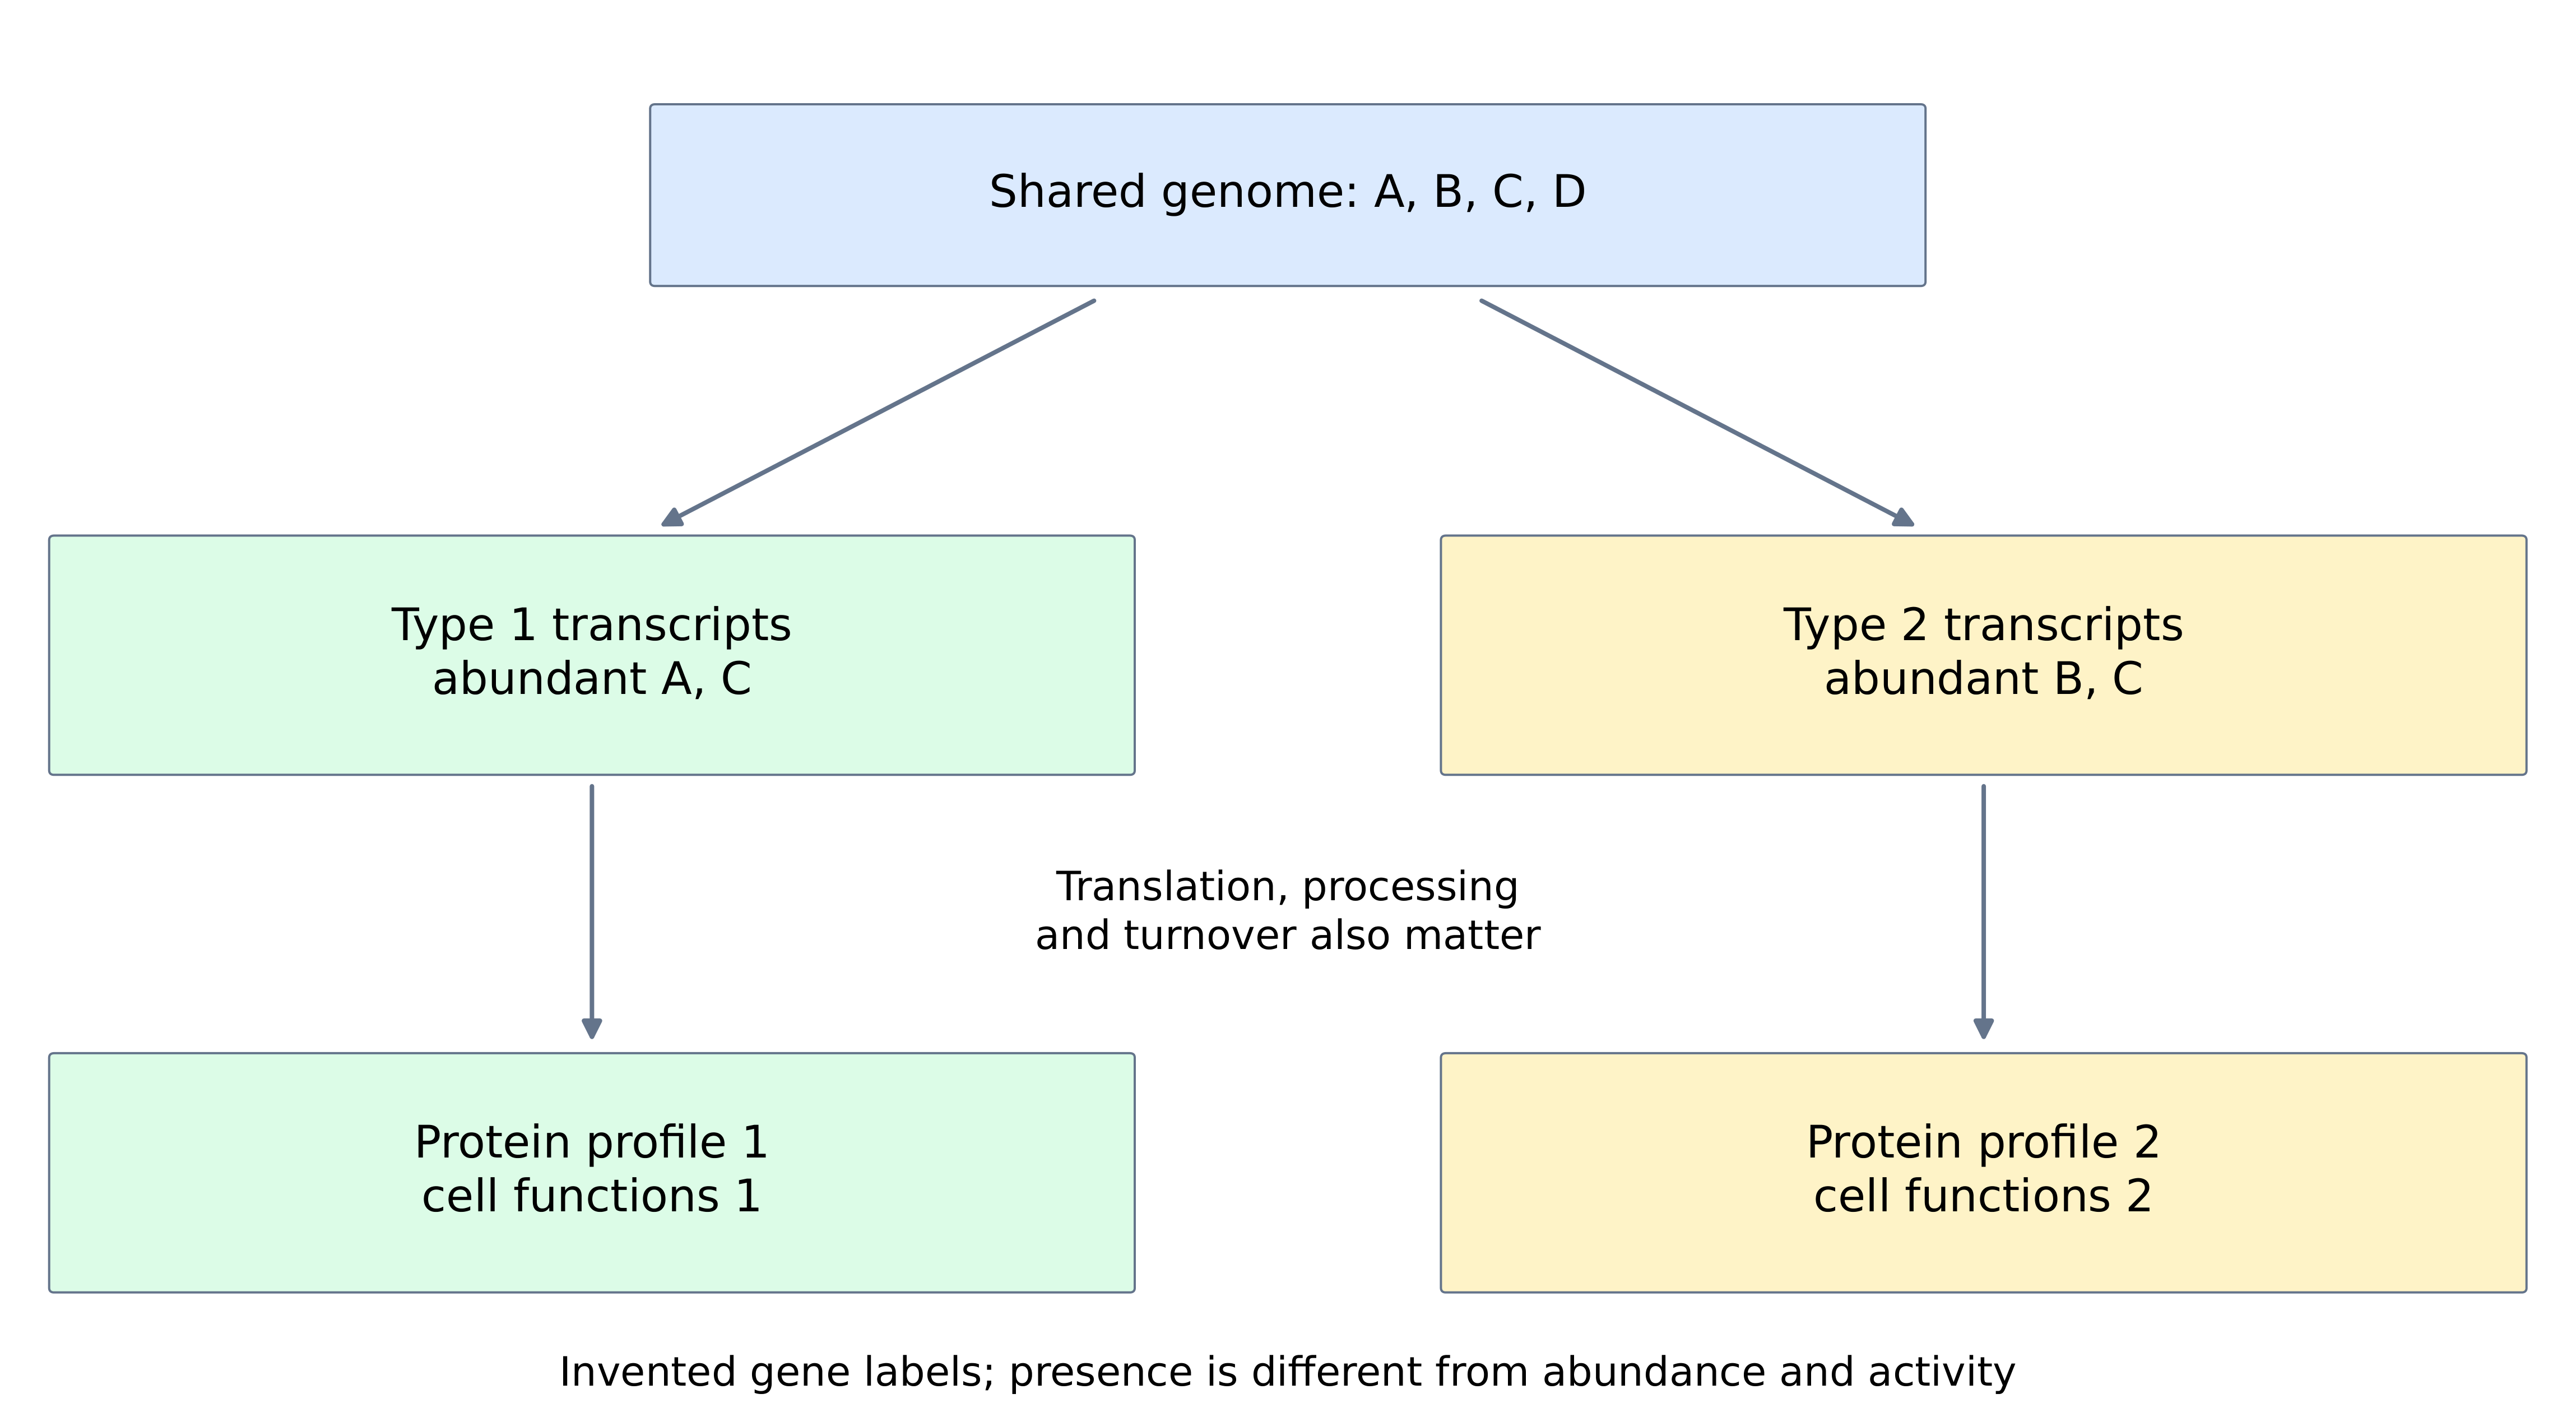
- The genome is genetic information, the transcriptome the RNA present, and the proteome the proteins present under specified conditions. Differentiated nucleated cells can retain essentially the same genome while expressing different sets and amounts of products. A mature red cell without a nucleus is not the right example for comparing two retained nuclear genomes.
- In the invented profiles below, both cell types retain genes A–D but have different transcripts and proteins. Gene absence, undetectable RNA and absent active protein are different observations. Selective expression supports differentiation; development of these patterns is described as epigenesis in this context, without requiring deletion of unused genes.
AHL: Distinguish regulatory DNA from the proteins binding it
- A promoter is DNA associated with initiation; an enhancer is regulatory DNA whose bound proteins can increase transcription. A transcription factor is protein, recognizing particular sequences and interacting with other machinery. DNA folding can bring an enhancer near a promoter in space despite their separation along the sequence.
- Combinations of factors and chromatin accessibility help determine the response; regulatory proteins can also reduce transcription. One binding event does not guarantee full activation, and a factor-concentration change can alter expression without mutating the target gene. Promoter and enhancer sequences do not first need translation to act as DNA.
AHL: Trace a hormone-dependent transcription response
- Cortisol can enter a responsive cell and bind an intracellular glucocorticoid receptor. Activated receptor interactions with regulatory DNA and partners can alter target transcription, then later product availability. Receptor distribution and accessible sites help explain why not every cell or gene responds alike.
- Changing gene-product supply differs from immediately activating an enzyme already present. Measure receptor context, target RNA, protein and activity at relevant times. More transcript alone does not establish proportional active enzyme: translation, processing, partners and degradation can intervene.
AHL: Explain message abundance through synthesis and removal
- An intact available mRNA can be translated repeatedly before nucleases degrade it. Human message lifetimes vary from minutes to days. Short persistence can permit faster changes in production, while a longer-lived message supports repeated translation without retranscription each time.
- A high RNA amount can reflect greater synthesis, slower removal or both. A time course after stopping new transcription can help estimate persistence, while considering the intervention's other effects. Existing protein can outlast its message; an abundant message can also yield little active protein if translation or maturation is restricted.
AHL: Count elapsed half-lives before predicting remaining RNA
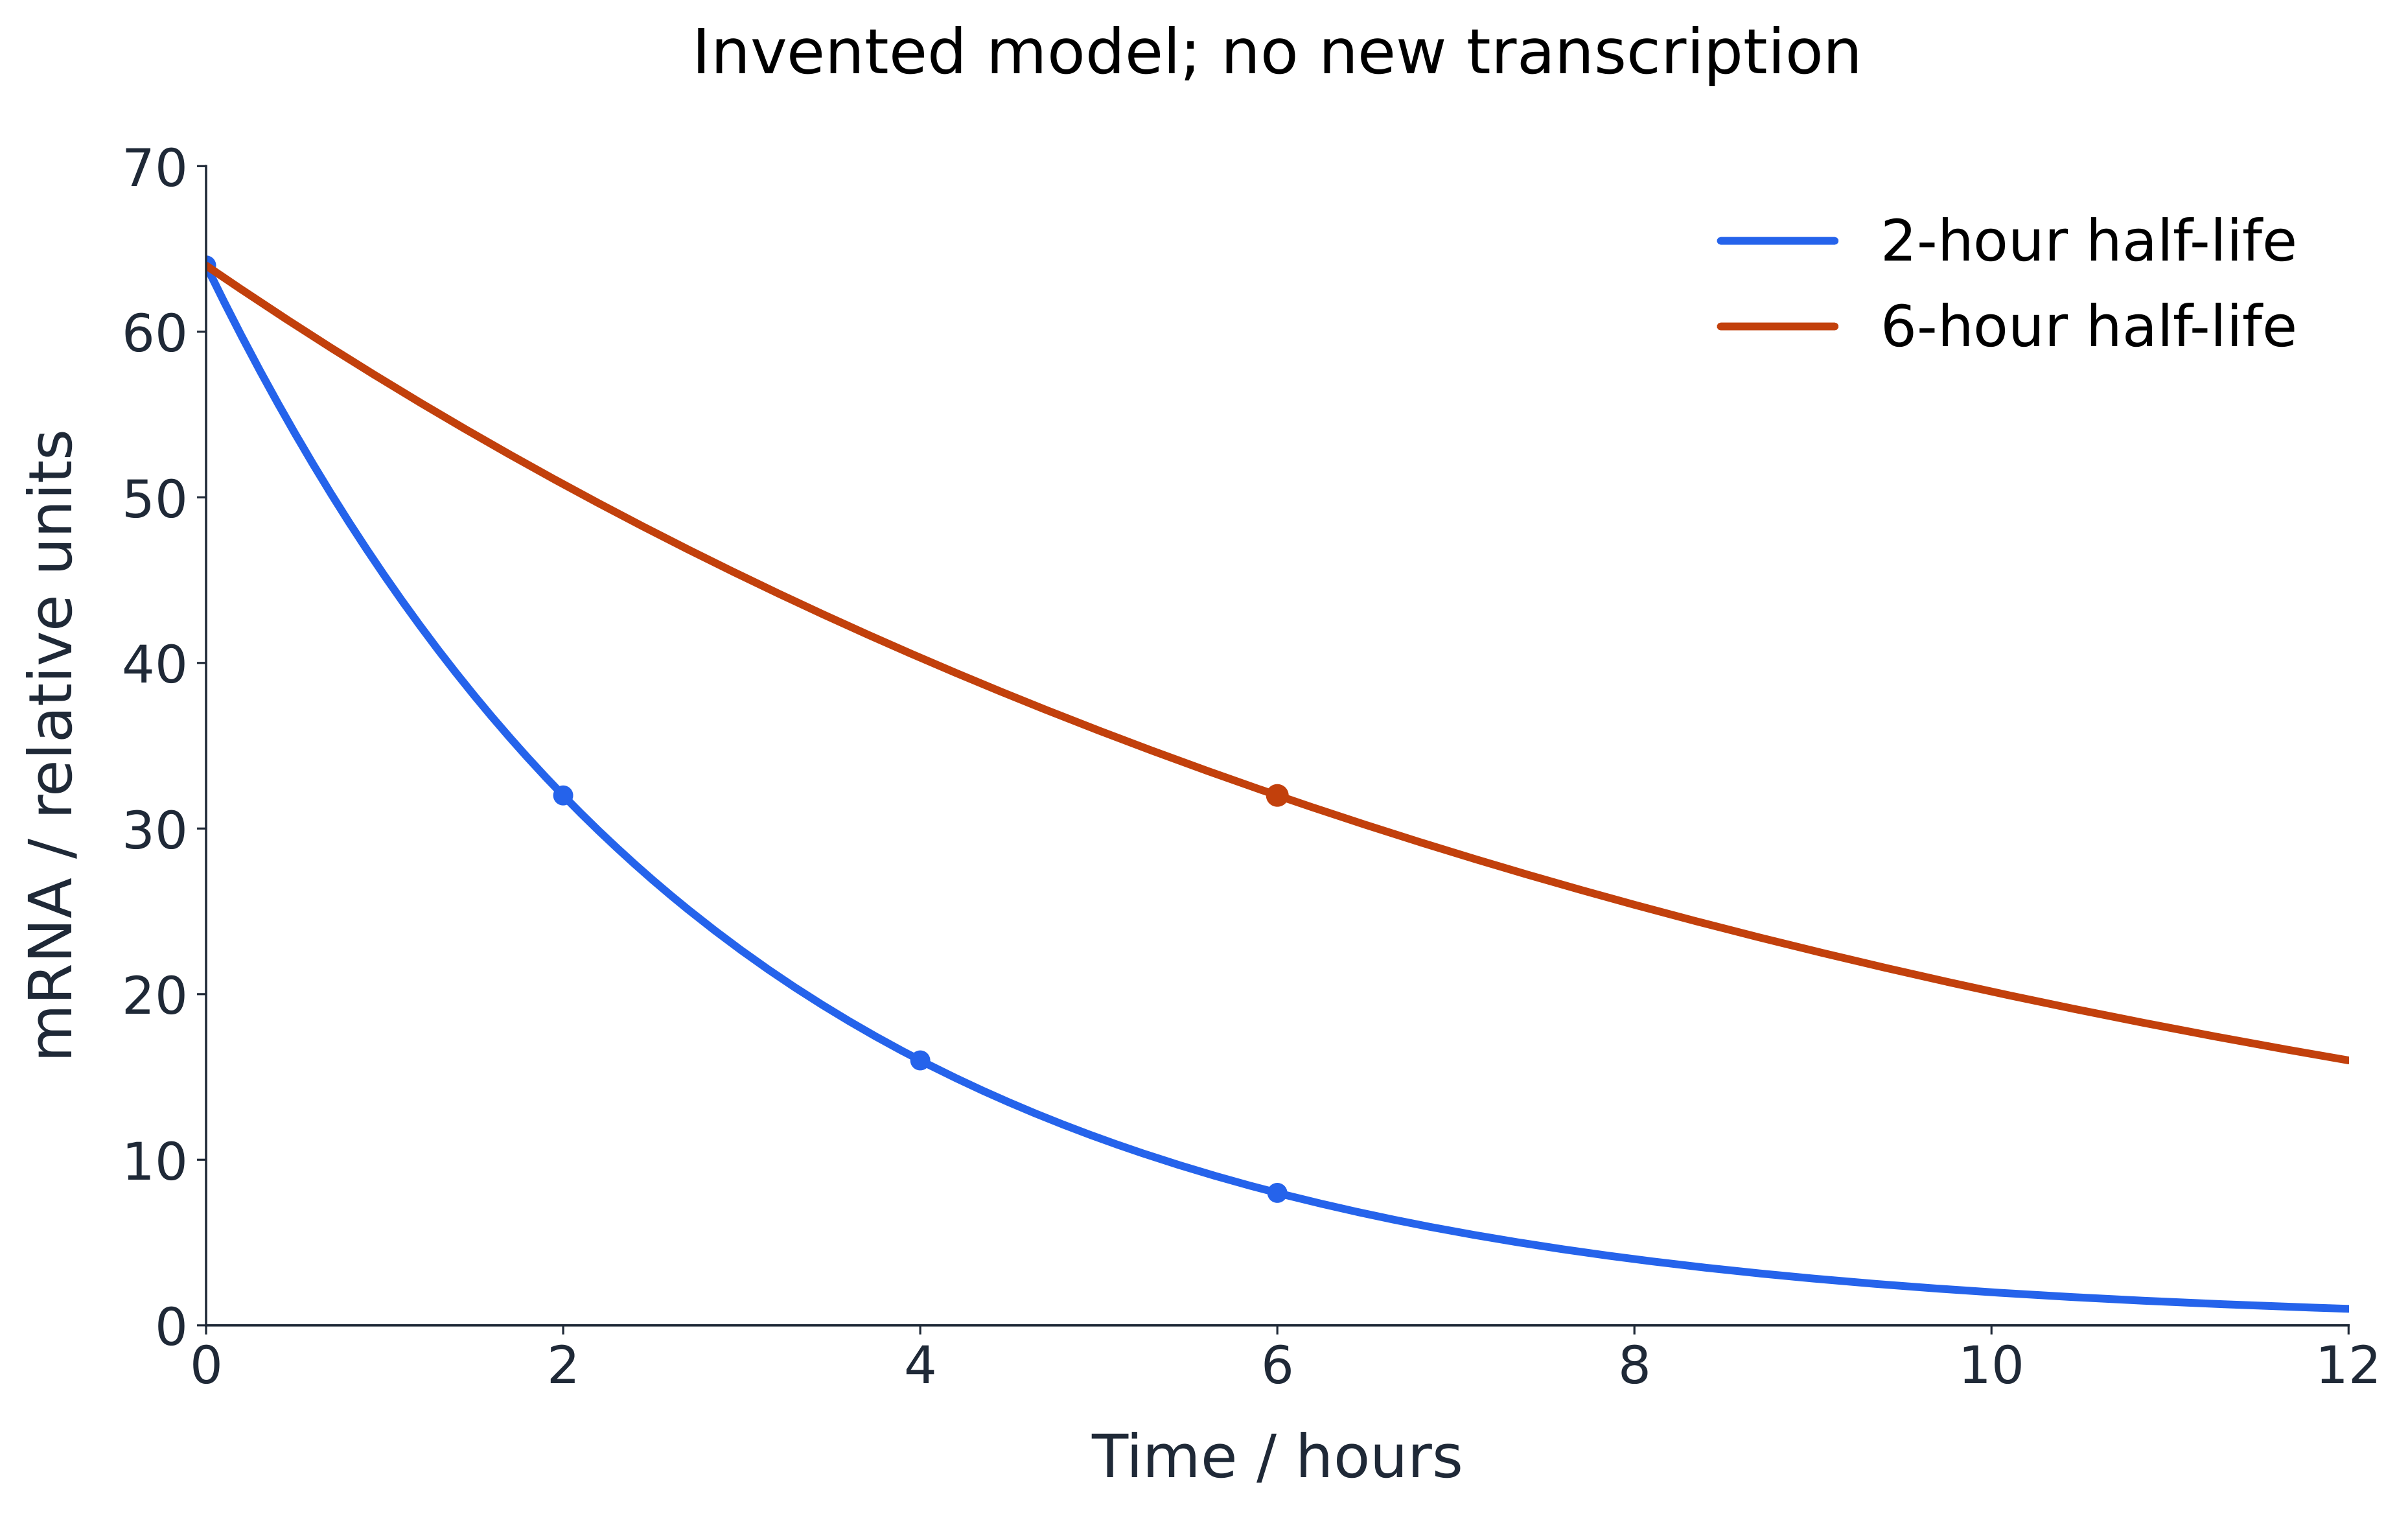
- With no new synthesis and constant two-hour half-life, an invented starting amount of 64 becomes 32, 16 and eight after two, four and six hours. At a six-hour half-life instead, 32 remain after six hours. Equal initial DNA and RNA amounts need not give equal later message abundance.
- A separate invented message starting at 80 units with a ten-minute half-life has ten left after thirty minutes: three successive halvings. This is an exponential-decay model, not subtraction of a fixed number every interval. Its inferred RNA change does not dictate the same immediate protein change.
AHL: An invented RNA sample starts at 80 units, has a constant ten-minute half-life and receives no new transcription. How many units remain after thirty minutes?
Dificultad 2/5 · 140 monedas + un pequeño bono en el primer intento de hoy
Thirty minutes is three half-lives: 80 → 40 → 20 → 10. This models RNA decay, not necessarily an identical immediate decline in active protein.
AHL: Keep a chemical tag distinct from a base substitution
- DNA methylation can influence expression without changing the base sequence. In the promoter model here, cytosine methylation represses downstream transcription; the tagged cytosine is not replaced by thymine. A regulatory sequence mutation would be a different explanation.
- Histones also carry modifications. Histone methylation can be associated with activation or repression depending on the site and pattern, so “all methylation switches every gene off” is unreliable. Compare the measured mark, its location and RNA/function evidence rather than assigning one effect to every tag everywhere.
AHL: Distinguish mitotic persistence from transmission across generations
- Retaining or restoring tags through cell division can preserve a differentiated expression state in daughter cells. This epigenetic inheritance need not change nucleotide sequence. It does not establish that every environmentally acquired tag passes unchanged to grandchildren.
- Many states are reset during germ-cell and early embryonic development. Some parent-of-origin marks persist through particular stages, while imprints are erased and established afresh in developing germ cells according to the sex of the individual producing gametes. Imprinting affects allele activity; it does not remove one parent's whole genome.
AHL: Use reciprocal hybrids as a qualified parent-of-origin model
- A liger has a lion father and tiger mother; a tigon reverses those parents. Ligers commonly grow larger than tigons. The course's imprinting model explains how parent-specific regulation can make reciprocal species contributions yield different expression of growth-related information.
- Size alone does not identify one methylated site or prove one gene causes every hybrid difference. Maternal environment and other species-specific genetic/regulatory interactions can contribute. Use the example to frame a parent-of-origin hypothesis, then identify the molecular and developmental evidence needed to test it.
AHL: Evaluate the actual exposure and measured epigenome
- A 2021 controlled diesel-exposure crossover study compared diesel exhaust with clean air in thirteen volunteers and measured bronchial epithelial DNA methylation. Differences at particular sites and regions support an exposure effect on the measured epigenome under those conditions.
- The result does not establish every site changing, lifelong persistence, offspring inheritance or the whole tag-to-disease pathway. Compare relevant tissue, cell composition, timing and covariates, then measure RNA and function for a proposed regulatory mechanism. Use published data rather than exposing students to pollution.
AHL: Interpret twin-pair evidence with the right denominator
- Monozygotic twins develop from one zygote and share essentially the same inherited DNA, helping reduce some genetic confounding. In Fraga and colleagues' 2005 study, fourteen of forty studied pairs differed significantly in the global methylation and histone-acetylation measures examined: 35% of pairs, not 35% of all genes.
- Differences were associated with age, but lifelong environments were not randomly assigned. Later mutations, cell composition, developmental differences and epigenetic drift can also contribute. Compare the same tissue and recorded exposures, with adequate pairs and longitudinal measures; a within-pair contrast is not by itself proof that one lifestyle caused every change.
AHL: In the cited 2005 study, 14 of 40 twin pairs differed significantly for the specified global epigenetic measurements. Calculate the percentage of studied pairs.
Dificultad 2/5 · 140 monedas + un pequeño bono en el primer intento de hoy
14/40 × 100 = 35% of studied pairs for the measured features. It is not 35% of all genes or proof that one specific lifestyle caused the differences.
AHL: Trace end-product repression in the trp model
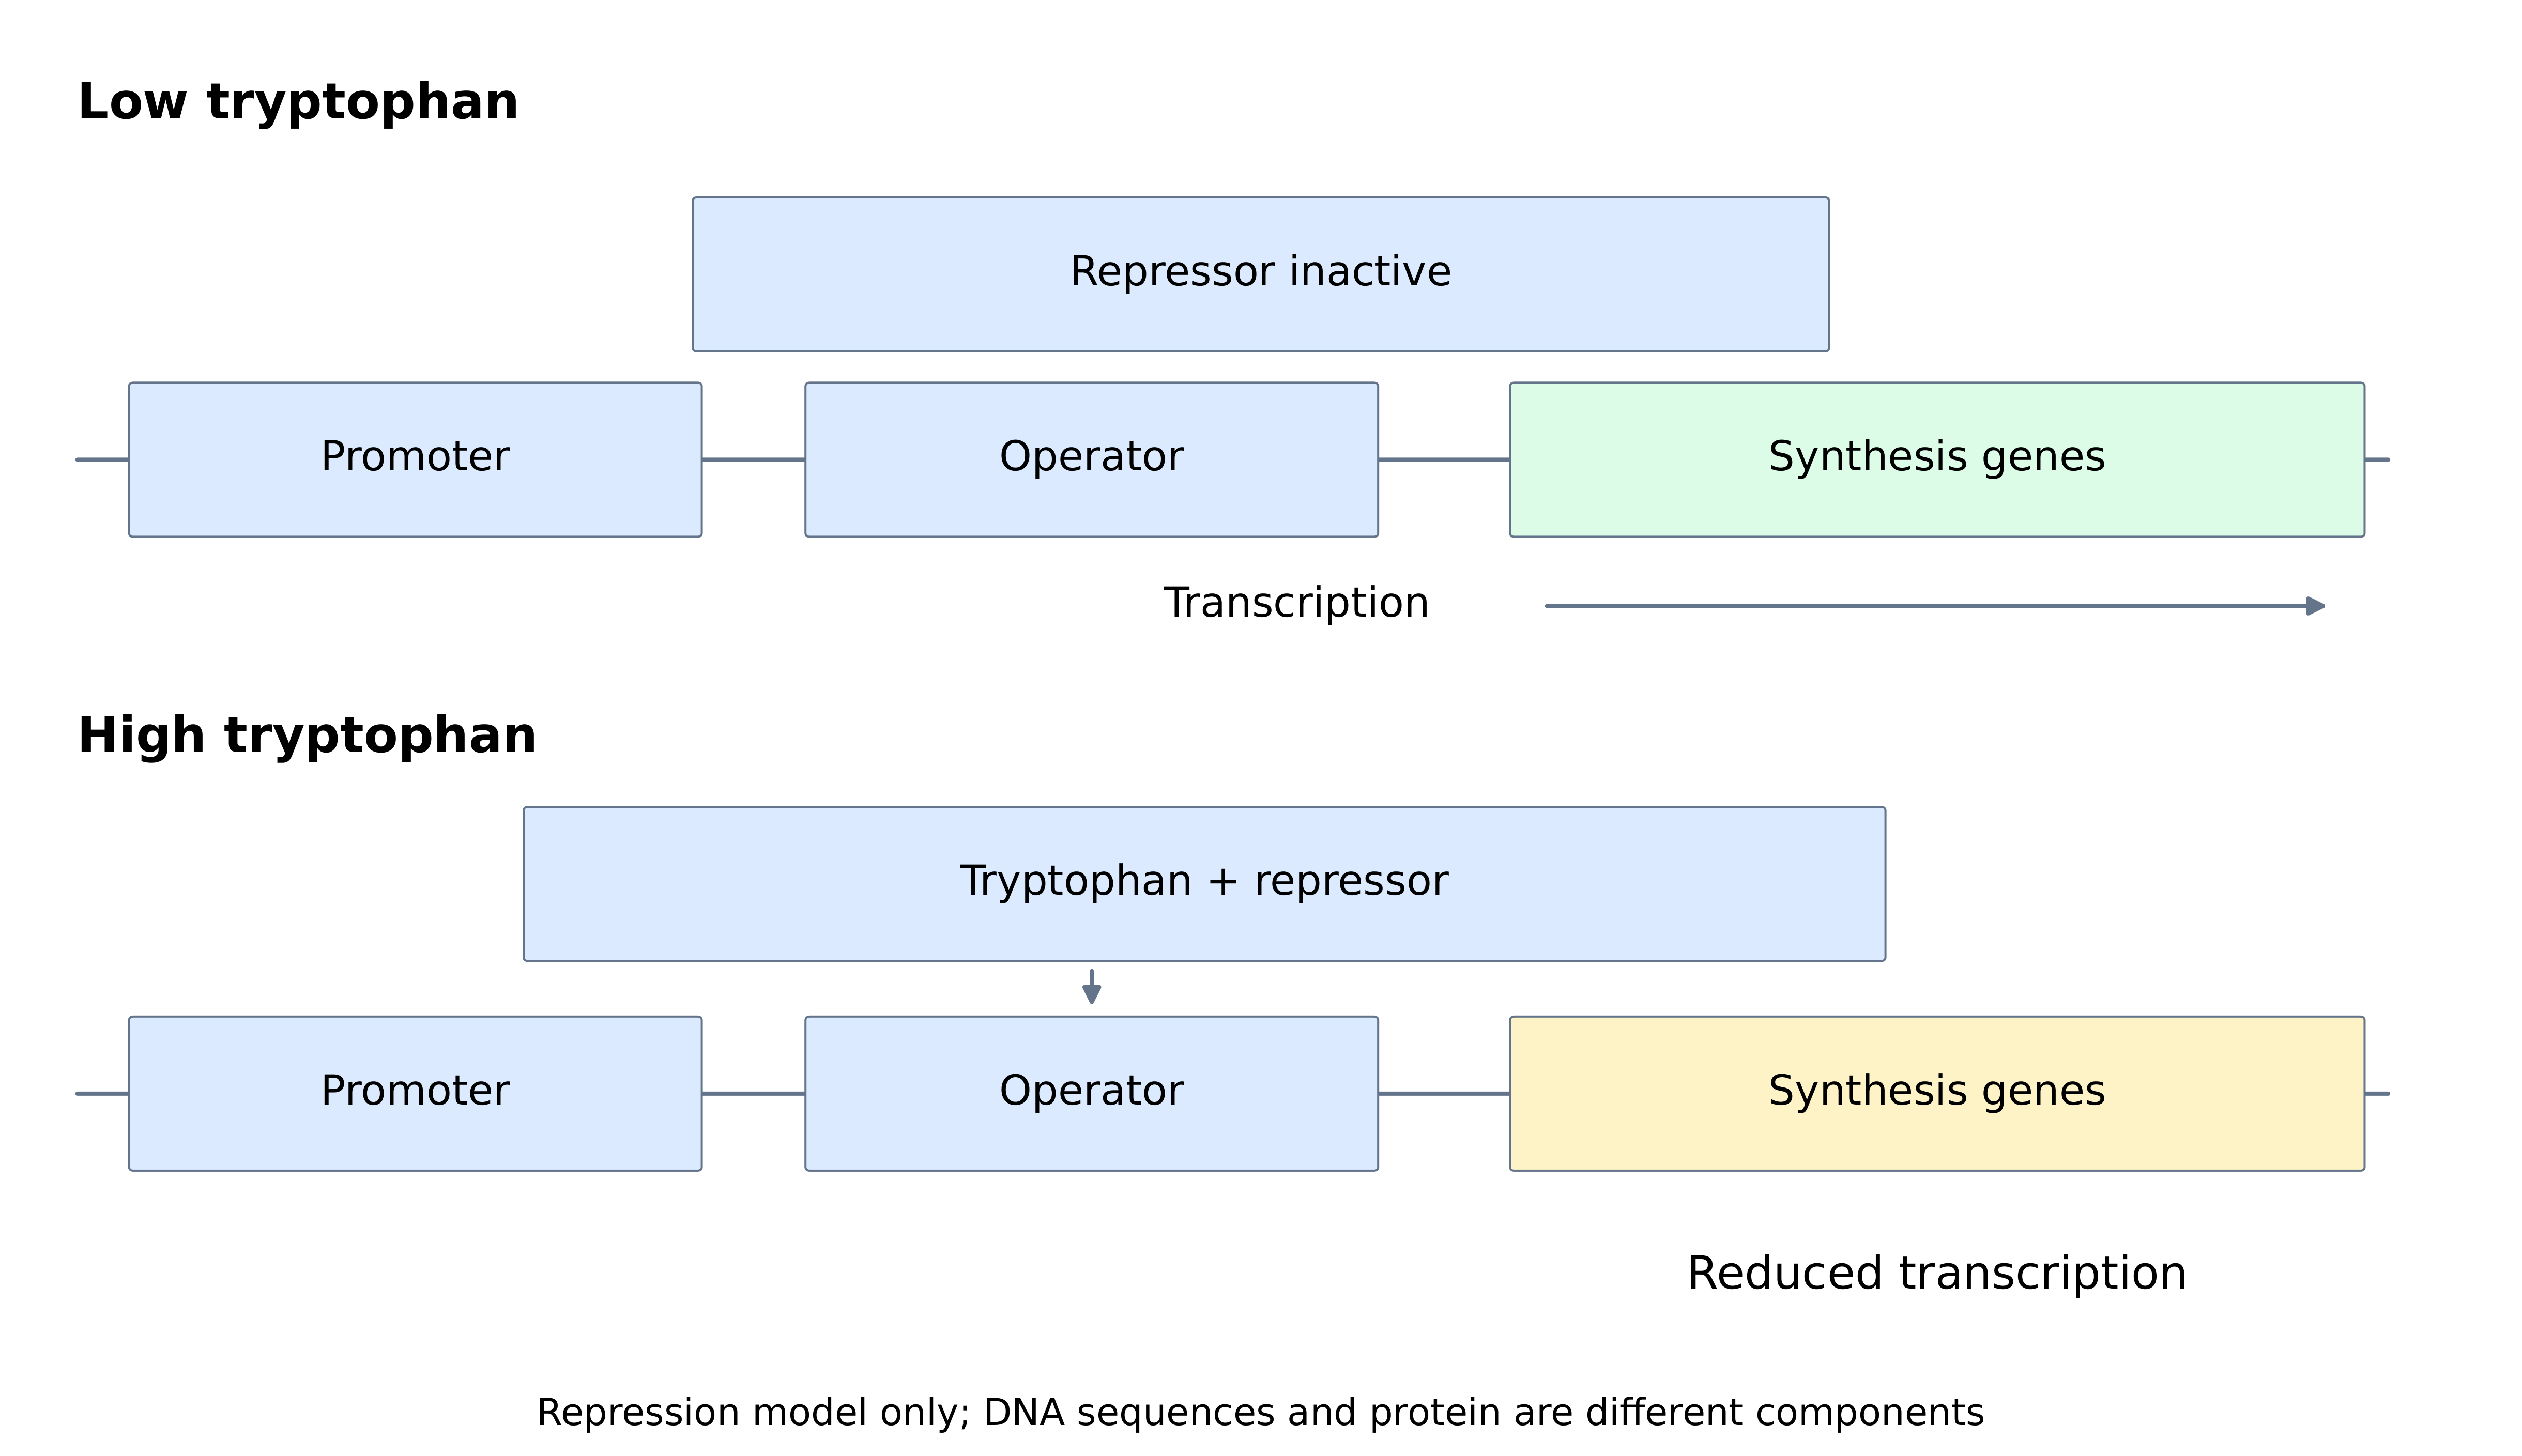
- At low tryptophan in the simplified bacterial model, the repressor does not effectively bind the operator and biosynthetic-gene transcription can proceed. At high tryptophan, the amino acid acts as a corepressor, changing the repressor's binding state so it binds the operator and reduces transcription.
- Operator and promoter are DNA, repressor is protein, and tryptophan is the small molecule regulating that protein. It does not itself become a DNA-binding transcription factor. This negative feedback changes supply of biosynthetic enzymes, differing from direct inhibition of an enzyme already present. The real operon has additional controls beyond this isolated repression model.
AHL: Which statement fits the simplified high-tryptophan repression model?
Dificultad 1/5 · 100 monedas + un pequeño bono en el primer intento de hoy
The small molecule changes a regulatory protein’s binding state. Promoter/operator are DNA; the response targets the relevant genes, and this repression model differs from direct inhibition of a pre-existing enzyme.
AHL: Normalize before interpreting a raw fold change
- Invented target/reference values of 60/20 in control and 120/40 in treatment both normalize to three. Normalized fold change is one despite twice the raw target signal. Equal normalized abundance does not imply equal absolute cell counts in the original samples.
- A different comparison of already normalized abundances 12 and three gives a fourfold final level and a 300% increase, not a 4% or 400% increase. Choose a suitable stable reference and state the measured quantity and denominator. A ratio alone does not establish statistical significance.
AHL: Invented target/reference values are 60/20 in control and 120/40 in treatment. Find normalized treatment/control fold change.
Dificultad 2/5 · 140 monedas + un pequeño bono en el primer intento de hoy
Control target/reference = 60/20 = 3; treatment target/reference = 120/40 = 3. Normalized fold change = treatment/control = 3/3 = 1. Raw target signal doubled, but so did the reference. Reference suitability and biological variation still affect interpretation.
AHL: Already normalized invented RNA abundances are 3 in control and 12 in treatment. Calculate percentage increase relative to control.
Dificultad 2/5 · 140 monedas + un pequeño bono en el primer intento de hoy
(12 − 3)/3 × 100 = 300%. A fourfold final value does not mean a 400% increase.
AHL: Combine perturbation, replication and downstream measurements
- Use independent biological samples, record variation and distinguish repeated assay readings from biological replication. A controlled factor perturbation can test a regulatory contribution, but off-target effects, viability and reference stability still need checking. Measure the proposed mark or binding event as well as the transcript.
- Follow the chain to protein abundance, modification and functional activity at appropriate times. A transcript rise alone does not establish direct DNA binding or a proportional metabolic change. Stable DNA, changing chromatin, message synthesis/removal and protein turnover offer different hypotheses that require different measurements.
AHL: Build a regulatory explanation with its limits
- Name the signal, receptor or regulator, DNA region, RNA change and downstream product/function being proposed. Keep genome, transcriptome and proteome distinct; use a decay time course and normalized comparisons before assigning every abundance difference to transcription.
- For inheritance, distinguish daughter-cell memory from evidence across generations and account for resetting. For exposure or twin data, state the actual participants, tissue and measured marks, then identify alternatives and useful next observations. A tag association, a fold change or a reciprocal-hybrid size difference is a starting point for explanation, not proof of every molecular step.
A treatment doubles raw target-RNA signal and changes methylation at one site. Explain what to check before claiming the tag caused a twofold increase in functional protein inherited by future generations.
A regulatory explanation needs evidence for each stage, with quantities, timing and inheritance boundaries specified.