Ciencia de datos
Introducido| English | Significado |
|---|---|
| data science/ˈdeɪtə ˈsaɪəns/ | ciencia de datos |
| descriptive statistics/dɪˈskrɪptɪv stəˈtɪstɪks/ | estadística descriptiva |
| visualisation/ˌvɪʒuːəlaɪˈzeɪʃn/ | visualización |
| correlation is not causation/ˌkɒrɪˈleɪʃn ɪz nɒt kɔːˈseɪʃn/ | la correlación no implica causalidad |
Five students answer, but only four give a time
- A fictional commute survey has five rows: 10, 20, 30, 40 and one blank, measured in minutes. Calling the blank zero changes the result.
- Data science 数据科学 combines a question, data preparation, analysis and interpretation. Begin by stating which students and which journey the question concerns.
Check what a suspicious value means
- Inspect units, impossible values, repeated rows and missing fields. A repeated value is not automatically a duplicate person, and an unusual value is not automatically an error.
- Keep a record of each correction or exclusion. If one field is blank, other usable fields in that row may still support a different analysis.
Eliminar todas las filas con algún campo en blanco siempre es una decisión de limpieza neutral.
Dificultad 1/5 · 100 monedas + un pequeño bono en el primer intento de hoy
Pueden permanecer campos útiles, y la falta de datos puede sesgar qué observaciones se retienen.
Dos encuestados pueden dar el mismo tiempo de desplazamiento sin que ninguna fila sea duplicada.
Dificultad 1/5 · 100 monedas + un pequeño bono en el primer intento de hoy
Verdadero. Los valores iguales son comunes; revise los registros de identidad y colección antes de eliminar cualquier dato.
Use the denominator that matches the question
- Descriptive statistics 描述性统计 summarize the observed data. Here the four recorded times total 100 minutes: mean 25 and median 25, with four valid times from five respondents.
- A visualisation 可视化 should state its units and population. Do not label the mean as the mean for all five students unless the missing value is resolved.
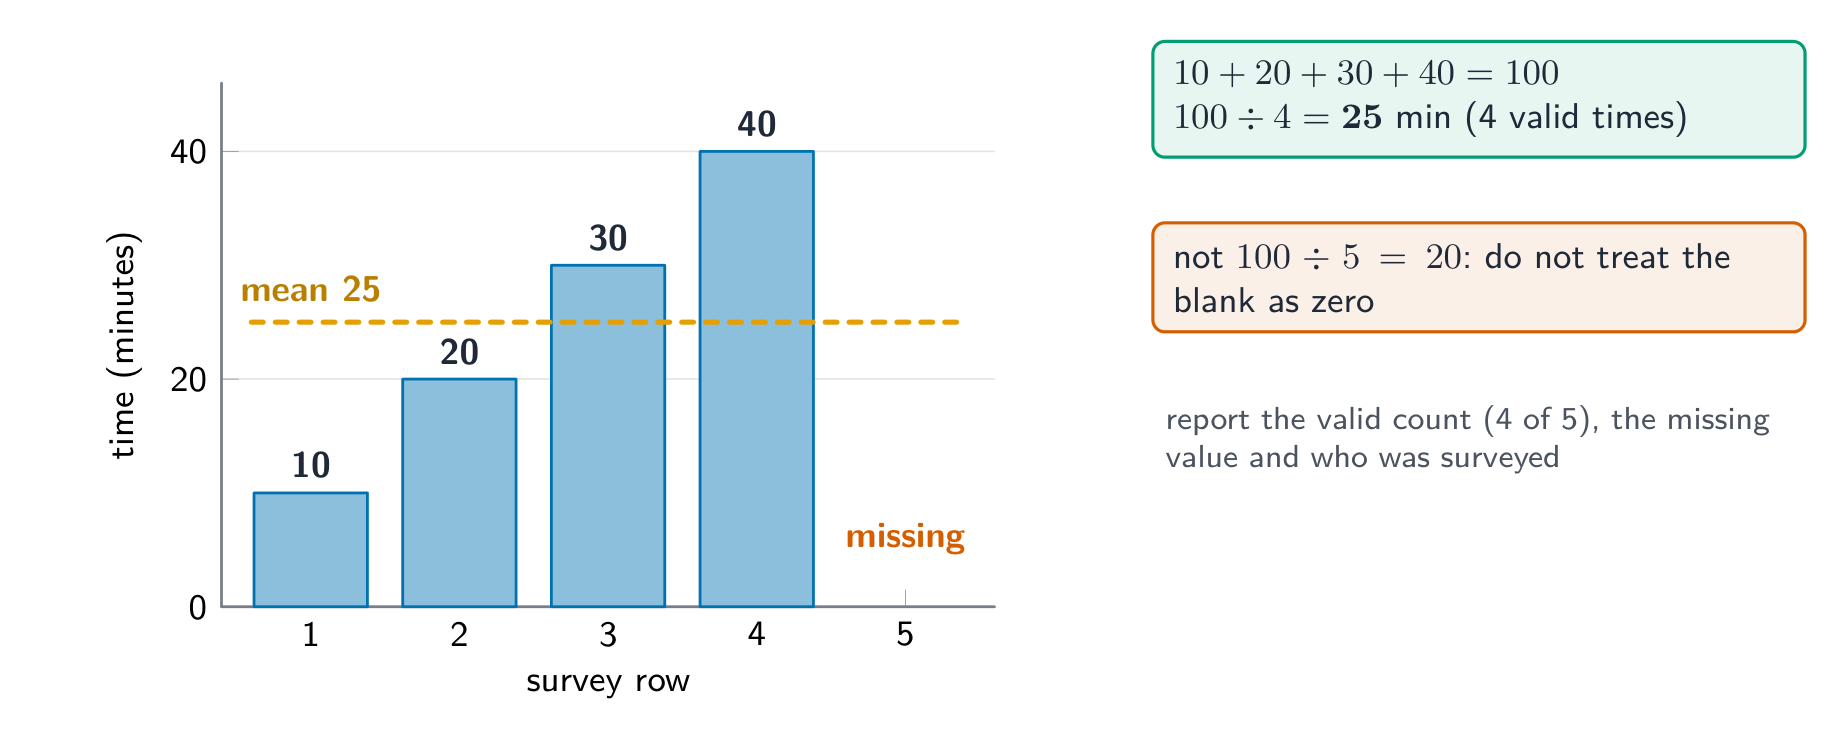
Los tiempos registrados son 10, 20, 30 y 40 minutos, con un espacio en blanco adicional. ¿Cuál es la media de los tiempos registrados?
Dificultad 2/5 · 140 monedas + un pequeño bono en el primer intento de hoy
El total 100 se divide entre cuatro tiempos registrados válidos, dando 25 minutos.
Choose the chart for the comparison
- Use a bar chart to compare categories, a line chart for an ordered time series, and a scatter plot to examine two numeric variables together.
- Give the chart a useful title, labelled axes, units and the relevant sample size. A viewer must know what each value represents.
Empareje cada comparación con un gráfico inicial adecuado.
Dificultad 2/5 · 140 monedas + un pequeño bono en el primer intento de hoy
Elija un gráfico que exprese la relación de los datos.
Un eje sin etiqueta aún permite al lector conocer la unidad y la variable medida de manera fiable.
Dificultad 1/5 · 100 monedas + un pequeño bono en el primer intento de hoy
Proporcione la variable y las unidades; un lector no debería tener que adivinar.
Separate a pattern from its cause
- Correlation is not causation 相关不等于因果: an observed relationship alone does not show that one variable produced the other. Other factors and the study design matter.
- If a survey finds longer commuters sleep less, describe the association within the respondents. Do not conclude that changing commute time alone will change sleep.
Los encuestados con trayectos más largos reportan menos sueño. ¿Qué conclusión está respaldada?
Dificultad 1/5 · 100 monedas + un pequeño bono en el primer intento de hoy
La observación no aísla un efecto causal ni justifica una afirmación sobre una población más amplia.
Report a finding with its limits
- Report: “The four recorded commute times have mean 25 minutes; one of five respondents did not give a time.” Missingness can affect how representative the result is.
- State the sample and collection limits before recommending action. A one-class survey does not establish a result for every student in the city.
Question → checked data → transparent calculation → labelled chart → limited conclusion. Missing values and sample boundaries belong in the explanation.
Escribe una limitación de una encuesta de 60 estudiantes de una sola clase.
Dificultad 3/5 · 200 monedas + un pequeño bono en el primer intento de hoy
Una clase puede diferir de otras clases, por lo que el resultado no debe generalizarse automáticamente a la ciudad.
¿Cuál informa transparentemente sobre el resultado del desplazamiento?
Dificultad 1/5 · 100 monedas + un pequeño bono en el primer intento de hoy
Indique el denominador válido y el conteo de valores faltantes.