Lectura: argumentos, textos emparejados y evidencia gráfica
Introducido| English | Significado |
|---|---|
| graphic/ˈɡræfɪk/ | gráfico |
| integrate/ˈɪntɪɡreɪt/ | integrar |
A passage with a graph
- A passage argues that a city's new bus lanes cut commute times. A graph shows average commute times before and after.
- ACT Reading includes argument evaluation, paired passages and graphics 图表; the task is to integrate 整合 them without reading more into the data than it shows.
Does the evidence support the argument?
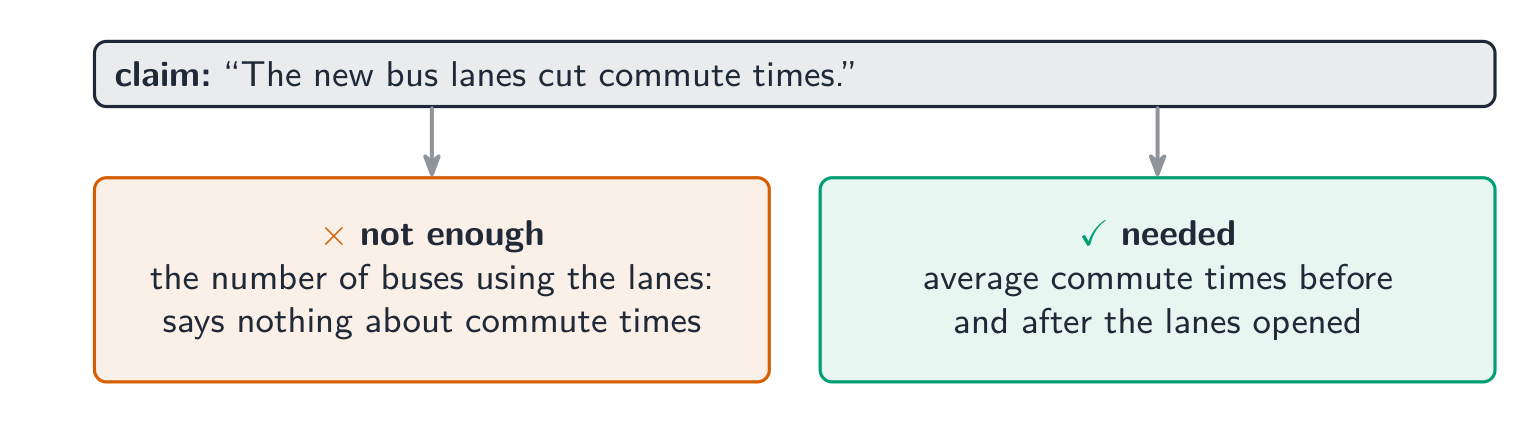
- Match the claim to the evidence: "commutes got shorter" needs before-and-after times, not just the number of buses.
- Notice what the evidence cannot show: a drop after the lanes opened does not rule out other causes (new trains, fewer workers).
Claim: “The new reading programme improved test scores.” Which evidence would most directly support it?
Dificultad 1/5 · 100 monedas + un pequeño bono en el primer intento de hoy
It shows the change and compares with a school without the programme.
Paired texts
- State each author's claim separately; then compare: agree, disagree, or one qualifies the other.
- A question like "How would the author of Passage B respond to …?" must use Passage B's reasoning.
Passage A: bus lanes cut commute times. Passage B: they help bus riders but slow car traffic. B qualifies A — agreeing about buses, adding a cost for cars.
Passage A: “Homework improves learning.” Passage B: “Homework helps older students, but younger children gain little from it.” B most likely regards A's claim as
Dificultad 1/5 · 100 monedas + un pequeño bono en el primer intento de hoy
B qualifies A by limiting it to older students.
Put the paired-passage method in order.
Dificultad 3/5 · 200 monedas + un pequeño bono en el primer intento de hoy
Separate first, then compare.
Reading the graphic
- Read title, axes, units and labels first; find the exact values the question names.
- Choose the statement that the graph shows, not one that would need data it does not include.
¿Qué muestra el gráfico?
Separe lo que los datos muestran de lo que no pueden mostrar.
If a graph shows commute times fell after bus lanes opened, it proves the bus lanes caused the fall.
Dificultad 1/5 · 100 monedas + un pequeño bono en el primer intento de hoy
Other changes may explain it; the graph shows timing, not cause.
Before reading values from a graph, check its title, axes and ____.
Dificultad 1/5 · 100 monedas + un pequeño bono en el primer intento de hoy
Units and labels prevent misreading.
Traps
- Correlation read as cause: commutes fell after the change; the graph alone does not prove why.
- Merging authors: an answer that gives Passage A's view to Passage B.
Recap
- Match evidence to the exact claim and note what it cannot show.
- Keep paired authors separate; read graphics by their labels and claim only what the data shows.
- graphic: A chart, table or diagram that presents data.
- integrate: To combine information from text and graphics into one answer.