您的已保存位置保留在此浏览器中。恢复操作不会完成课程或回答其中的问题。
A bigger share doesn't mean more journeys
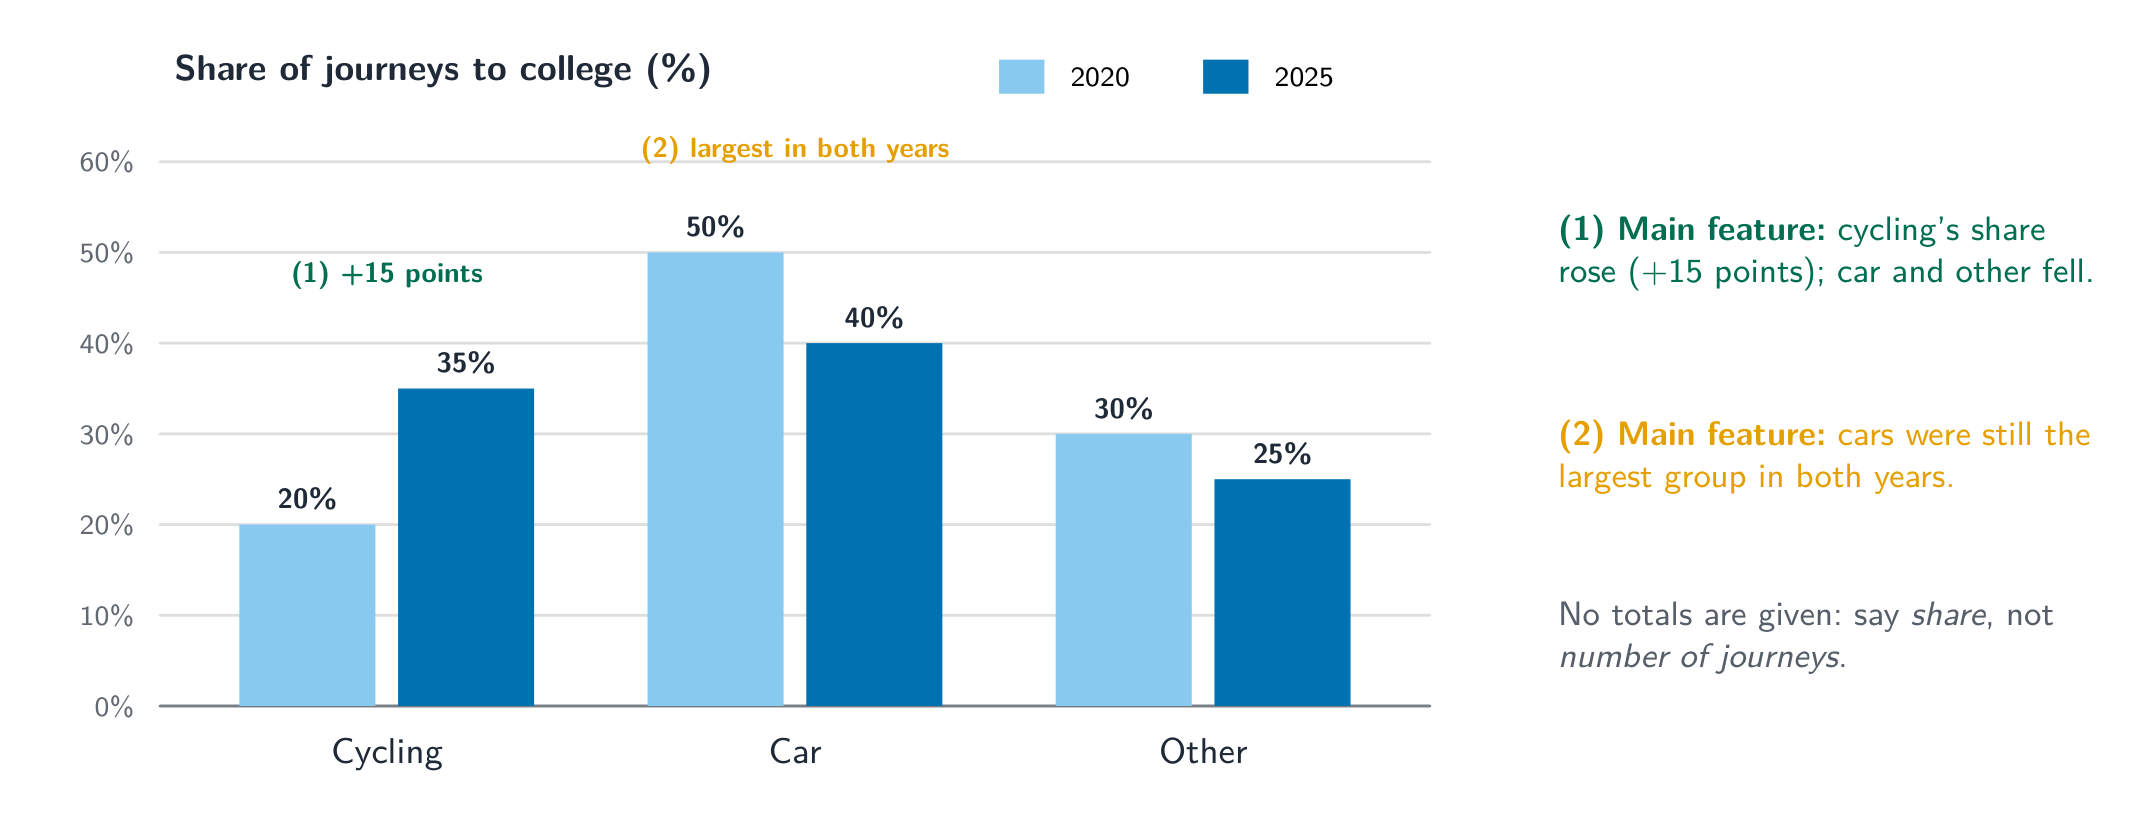
- Goal: choose the main features, group accurate comparisons, and write and revise a connected report. Start with Academic Writing orientation and the writing criteria. A survey: cycling 20% in 2020 → 35% in 2025; cars 50% → 40%; other travel 30% → 25%. Cycling gained share, the others lost share, and cars stayed the largest group.
- The totals aren't given, so you can't say the number of cycling journeys rose — or that a new cycle lane caused anything. A percentage knows its share of the pie, but not how big the whole pie was.
Task 1 里应该解释趋势出现的原因。
难度 1/5 · 今日首次完成可获 100 金币及少量额外奖励
Report what the visual information supports. An invented cause is unsupported and takes space from the task; no single sentence establishes an automatic score cap.
The overview: the main picture in one or two sentences
- Cycling gained share while the other categories declined, although cars remained the most common choice. That's an overview: it sums up the patterns. Cycling was 20% in 2020 is a detail that supports it.
- What counts as a main feature depends on the visual: the biggest category, the largest change, a crossover, or something that stayed the same. Don't invent a crossover if there isn't one.
In a visual with an important overall movement and a major line crossover, which features could be selected for the overview? Choose all that apply.
难度 2/5 · 今日首次完成可获 140 金币及少量额外奖励
An overview selects the main patterns, such as the largest category or a major change. Supporting figures belong mainly in the detail paragraphs; avoid invented causes or opinions.
Group the details around comparisons
- A clear shape: say what the visual shows, give the overview, then two paragraphs of grouped details. Here: one paragraph for the rising cycling share, one for the falling ones, each with its numbers.
- That shape is common, not compulsory. Another visual may need a different organisation. What doesn't work is listing every number in the order it appears — the reader loses the relationships.
Put this suggested Task 1 plan in a useful order.
难度 3/5 · 今日首次完成可获 200 金币及少量额外奖励
This plan introduces the visual, summarises its main picture and develops grouped details. It is one usable structure, not a mandatory paragraph or overview placement rule.
Check the labels before claiming an amount
- Housing took 26% of income, then 38%. That's a larger share — not necessarily more money, because income may have changed too. With only percentages, keep your claims about shares.
- Pie charts can show counts, amounts or percentages, so read the labels and units. When the visual gives amounts, use them.
A percentage-only housing comparison rises from 26% to 38% of income; total incomes are not given. Which sentence is supported?
难度 1/5 · 今日首次完成可获 100 金币及少量额外奖励
The given percentages establish a larger share. Amount spent also depends on total income. A pie chart may show other units, so read its actual labels rather than generalising from its shape.
A diagram explicitly labels 120 bottles before sorting. What supports reporting that quantity?
难度 1/5 · 今日首次完成可获 100 金币及少量额外奖励
The diagram supplies the count. Process information can include quantities, temperatures and durations.
Processes and maps: describe what is labelled
- A process diagram may give temperatures, times or quantities as well as stages. Heat water to 80°C, then filter it → include the temperature and the order. Use the passive when who does it doesn't matter, the active when a named person or machine does.
- Maps may show past, present or planned layouts. Choose the tense from the date and status: In the proposed plan, the entrance will move east — it hasn't moved yet. Never add features the map doesn't show.
改成被动语态:People collect the bottles. → The bottles ___ collected.
难度 1/5 · 今日首次完成可获 100 金币及少量额外奖励
Are collected is the present passive form. It fits when the collection stage matters more than the actor; other process descriptions may appropriately use active verbs.
A map labels an eastern entrance as a proposed future change. Which description preserves that status?
难度 1/5 · 今日首次完成可获 100 金币及少量额外奖励
The proposal is a future layout. Do not claim that it has already been built.
Make every detail match the data
- Cycling rose by 15 percentage points, to 35%; cars fell by 10 points, to 40%. These details support the overview and keep the correct units.
- Format checked on 19 October 2026: IELTS Academic Writing format. The survey, process and map examples are our own.
- Choose the main picture, support it with accurate details, and keep every claim inside the data.
Match the distinctions in this worked case.
难度 2/5 · 今日首次完成可获 140 金币及少量额外奖励
Detail: cycling rose by 15 percentage points to 35%, while cars fell by 10 points to 40%. Both descriptions select comparisons from the same values without inventing a cause.
Which category has the largest share in 2025?
难度 1/5 · 今日首次完成可获 100 金币及少量额外奖励
Original data: cycle share is 20% in 2020 and 35% in 2025; car share is 50% and 40%; other travel is 30% and 25%. Overview: cycling rose while the other two shares fell; cars remained the largest category. Detail: cycling rose by 15 percentage points to 35%, while cars fell by 10 points to 40%. Both descriptions select comparisons from the same values without inventing a cause.
Cycling shares of 20% and 35% do not show whether the number of cycling journeys rose unless the totals are known.
难度 1/5 · 今日首次完成可获 100 金币及少量额外奖励
True. Counts need totals as well as shares; a smaller total could give the same or fewer journeys at 35%.
Different measures, different leaders
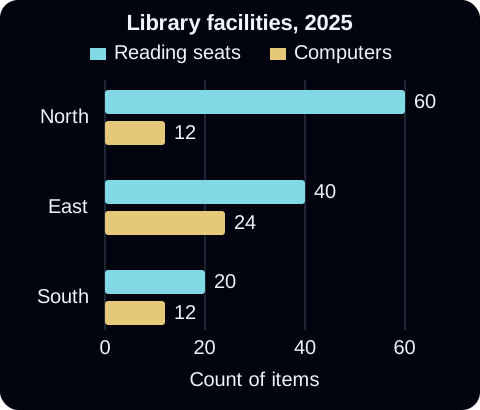
- One year, two measures. The chart below shows reading seats and computers at three libraries in 2025. North had the most facilities in every category misreads it. Better: North had the most reading seats, whereas East had the most computers; South had the fewest seats — with 60 seats at North, 24 computers at East, and 12 computers at both North and South. It's one year, so increased would invent a trend.
- Different units. A museum had 80,000 visits and £320,000 income in 2019, then 120,000 visits and £360,000 in 2024. Both rose by the same amount compares unlike units. Better: Both increased, but visits grew proportionally more — visits +50%, income +12.5%. Income per visit fell from £4 to £3, but that's an average you calculated, not a ticket price. A confident adjective cannot rescue the wrong denominator; it only makes the error stand taller.

Guided decisions: ten visuals with hints
- For each visual, first note the measure, unit, dates and any projection; then decide what belongs in the overview. Compare the start and end separately from the middle points: the same start and end value doesn't mean nothing changed in between.
- These are short decisions about what to write, not ten full reports. After each one, fix the exact problem the explanation names: wrong column, invented cause, wrong base, or a time claim the data doesn't support.
原始教学数据 — 河渡轮乘客:
| 年份 | 乘客数(千) |
|---|---|
| 2018 | 40 |
| 2020 | 55 |
| 2022 | 48 |
| 2024 | 70 |
决策: 哪个概述保留了采样模式?
选择一个答案。
规划提示: 比较端点,然后检查中间值。
难度 1/5 · 今日首次完成可获 100 金币及少量额外奖励
端点从40上升到70,但55下降到48,最后再次上升。翻倍需要80。未提供票价证据。概述可以包括总体趋势及其重要中断。
原始教学数据 — 2024中的三个体育中心:
| 中心 | 访问量(千) |
|---|---|
| Elm | 90 |
| Pine | 60 |
| Oak | 30 |
决策: 哪个是合适的主要比较?
选择一个答案。
规划提示: 单日比较只能得出排名,不能得出趋势。
难度 1/5 · 今日首次完成可获 100 金币及少量额外奖励
榆树的流量顺序为90到60再到30,且90是30的三倍。其中一年未显示变化或增长速度。松树的流量是榆树的三分之二,而橡树仅为三分之一。
原文教学数据 — 家庭能源占比:
| 来源 | 2015 (%) | 2025 (%) |
|---|---|---|
| 天然气 | 60 | 45 |
| 电力 | 30 | 40 |
| 其他 | 10 | 15 |
决策: 哪项变化陈述准确?
请选择一个答案。
规划提示: 保持 by、to 和单位符号独立不合并。
难度 1/5 · 今日首次完成可获 100 金币及少量额外奖励
60 减去 45 等于 15 个百分点;终点值为 45%。未提供计数或能源单位。相对降幅为 15/60 = 25%,而非 15%。
原始教学数据——读书俱乐部参与情况:
| 年份 | 会员总数 | 每周出席比例 (%) |
|---|---|---|
| 2020 | 200 | 40 |
| 2025 | 100 | 60 |
决策: 关于每周出席人数可以得出什么结论?
选择一项答案。
规划提示: 将每项比例乘以对应年份的总人数。
难度 1/5 · 今日首次完成可获 100 金币及少量额外奖励
40% of 200 is 80; 60% of 100 is 60. The share rises by 20 points while the count falls. Given totals allow this calculation; do not keep a count unknowable when the necessary data are present.
原始教学数据——2025地区的图书馆设施:
| 图书馆 | 阅读座位数 | 电脑台数 |
|---|---|---|
| 北馆 | 60 | 12 |
| 东馆 | 40 | 24 |
| 南馆 | 20 | 12 |
决策: 哪项概述同时涵盖了这两项指标?
选择一项答案。
规划提示: 某一列中的领先者未必在另一列中也是领先者。
难度 1/5 · 今日首次完成可获 100 金币及少量额外奖励
北指向60处的座位;东指向24处的电脑。建筑规模未作测量,且南与东在两项计数上均不相同。请保持每个排名与其对应度量值的关联。
原始教学数据——博物馆参观次数与收入:
| 年份 | 参观次数(千次) | 总收入(千英镑) |
|---|---|---|
| 2019 | 80 | 320 |
| 2024 | 120 | 360 |
决策: 哪一项主要比较得到支持?
选择一项答案。
规划提示: 比较各项度量值内部的相对变化;不要比较无法相提并论的绝对差值。
难度 1/5 · 今日首次完成可获 100 金币及少量额外奖励
参观次数上升40/80 = 50%;收入上升40/320 = 12.5%。数值差相同,但单位与基数不同。每次参观的平均收入将从£4降至£3,但总收入无法直接确定门票价格。
原始教学数据——工作室会员人数:
| 年份 | 会员人数 |
|---|---|
| 2010 | 80 |
| 2015 | 120 |
| 2020 | 100 |
决策: 哪一句话避免了编造观察结果?
选择一项答案。
规划提示: 将峰值声明限制在所给时期及所提供的观察范围内。
难度 1/5 · 今日首次完成可获 100 金币及少量额外奖励
120是显示的最大数值;100仍高于80。未记录的年份及更早的历史情况未知。所示区间内呈现先升后降的趋势,而非持续下降。
原始教学数据——通勤方式类别:
| 方式 | 2020 (%) | 2025 (%) |
|---|---|---|
| 公交 | 40 | 30 |
| 铁路 | 20 | 30 |
| 步行 | 25 | 25 |
| 其他 | 15 | 15 |
决策: 哪一组分类能提供一份有用的报告计划?
选择一项答案。
规划提示: 对有意义的关系进行分组,同时保留重要的稳定特征。
难度 1/5 · 今日首次完成可获 100 金币及少量额外奖励
公交下降而铁路上升,在30%处交汇;步行和其他保持不变。这些分组保留了关键模式。两年中公交加铁路合计均为60%,但数据并未将变化归因于某项政策。公交和铁路呈相反方向变动,因此将它们归为“均增加”是不准确的。
原始教学数据——用水量估算:
| 年份 | 每户每天实际观测用水量(升) | 每户每天预测用水量(升) |
|---|---|---|
| 2020 | 180 | — |
| 2025 | 160 | — |
| 2030 | — | 140 |
决策: 哪一项描述能准确反映现状?
选择一项答案。
规划提示: 在选择时态之前,请先阅读“实际观测”和“预测”的标签。
难度 1/5 · 今日首次完成可获 100 金币及少量额外奖励
160是观察到的2025数值;140是2030年家庭平均值的预测值。预测值并非观察结果,也不是对每个家庭的精确保证。
原始教学数据——两项独立的访客调查:
| 地点 | 接受调查的访客数 | 偏好晚间入场比例(%) |
|---|---|---|
| 画廊 | 100 | 60 |
| 花园 | 200 | 40 |
决策: 哪一项比较准确?
选择一个答案。
规划提示: 在比较样本量不等的情况前,先计算具体人数。
难度 1/5 · 今日首次完成可获 100 金币及少量额外奖励
画廊:100/60;花园:200/80。第一个比例较高,但其具体人数较少。合并比例为140/300,而非60+40%。不同的调查基数不能直接相加为一个百分比。
Independent decisions: twenty new visuals
- No hints now. Some compare places in one year; others compare times, proportions, rates or mixed measures. Keep what is actually measured: visits can include repeat visitors, an index is not a count, and sales in current prices don't show growth after inflation.
- Choose the best answer, then say why the others distort the data. You can split this over several sessions — keep a short list of the mistakes you need to fix.
原始教学数据——渡轮巴士行程:
| 年份 | 行程次数(百万次) |
|---|---|
| 2016 | 12 |
| 2019 | 18 |
| 2022 | 15 |
| 2025 | 21 |
决策: 哪一个概览能涵盖所有四项观察结果?
选择一个答案。
难度 1/5 · 今日首次完成可获 100 金币及少量额外奖励
21高于12,而18在最终增长前降至15。若将12翻倍应为24,且最终水平高于起始点。在使用“未受中断”一词前,请检查中间节点。
原始教学数据——2023地区的三家画廊:
| 画廊名称 | 展览数量 |
|---|---|
| 雪松 | 12 |
| 白桦 | 8 |
| 柳 | 4 |
决策: 哪一项是比较且有据可依的?
选择一个答案。
难度 1/5 · 今日首次完成可获 100 金币及少量额外奖励
12是4的三倍。单一年份提供的是跨画廊比率,而非画廊内部的变化或前一年的减少量。桦树拥有雪松数量的三分之二,而非两倍。
原始教学数据——家庭支出份额:
| 类别 | 2014 (%) | 2024 (%) |
|---|---|---|
| 住房 | 25 | 40 |
| 食品 | 35 | 25 |
| 其他 | 40 | 35 |
决策: 哪句话使用了正确的变化单位?
请选择一个答案。
难度 1/5 · 今日首次完成可获 100 金币及少量额外奖励
40减去25等于15个百分点。相对增幅为15/25 = 60%;此处未给出总金额。新份额为40%,而非15%。
原文教学数据——俱乐部注册与出勤:
| 年份 | 注册人数 | 周出勤率 (%) |
|---|---|---|
| 2019 | 300 | 20 |
| 2024 | 200 | 40 |
结论: 哪项推论成立?
选择一个答案。
难度 1/5 · 今日首次完成可获 100 金币及少量额外奖励
300×20% = 60,且200×40% = 80。份额上升了20个百分点,相当于该份额翻倍。由于两个分母均已给出,应在决定人数趋势之前进行计算。
原始教学数据——2025中的三个学习中心:
| 中心 | 学习座位数 | 平板电脑数 |
|---|---|---|
| 西区 | 90 | 15 |
| 中央区 | 60 | 30 |
| 河滨区 | 30 | 15 |
决策: 哪个概述保留了主要排名?
请选择一个答案。
难度 1/5 · 今日首次完成可获 100 金币及少量额外奖励
90是座位数的最大值,而30是平板数量的最大值。River和West均拥有15台平板。未提供建筑面积数据。避免将两个特定排名替换为缺乏依据的整体规模声明。
原始教学数据——剧院观众与收入:
| 年份 | 观众人数(千人) | 总收入(千英镑) |
|---|---|---|
| 2018 | 50 | 250 |
| 2024 | 75 | 300 |
判断: 哪一项总结正确比较了增长情况?
请选择一个答案。
难度 1/5 · 今日首次完成可获 100 金币及少量额外奖励
25/50 = 50%;50/250 = 20%。每次出勤的收入从 £5 降至 £4,但收入未标注为仅来自门票,因此无法推断票价。保留分子、分母及所述收入指标。
原始教学数据——运河船只数量:
| 年份 | 船只数 |
|---|---|
| 2005 | 70 |
| 2010 | 110 |
| 2015 | 90 |
判断: 哪一表述恰当地限定了主张的范围?
请选择一个答案。
难度 1/5 · 今日首次完成可获 100 金币及少量额外奖励
110是显示的最大总数。完整历史及中间年份缺失;首个记录区间从70增至110。应将峰值主张限制在实际可获得的证据范围内。
原始教学数据——休闲活动占比:
| 活动 | 2015 (%) | 2025 (%) |
|---|---|---|
| 阅读 | 30 | 20 |
| 游戏 | 20 | 30 |
| 运动 | 25 | 25 |
| 其他 | 25 | 25 |
判断: 哪一项细节计划最有用?
请选择一个答案。
难度 1/5 · 今日首次完成可获 100 金币及少量额外奖励
阅读和游戏交换了位置,而运动和保持相等且不变。有意义的分组能展示这些关系;孤立的最小类别则忽略了它们。数据未识别个体转换及其原因。
原始教学数据——仓库用电量:
| 年份 | 状态 | 每平方米千瓦时 |
|---|---|---|
| 2020 | 观测值 | 100 |
| 2025 | 观测值 | 80 |
| 2030 | 预测值 | 70 |
判断: 哪一项描述准确?
请选择一个答案。
难度 1/5 · 今日首次完成可获 100 金币及少量额外奖励
该指标为按面积计算的用电量,而非账单或总用量。仅2020/2025为观测值;2030为预测值。按面积计算的值并不能表明每栋建筑的总用电量相同。
原始教学数据——两门课程调查:
| 课程 | 受访者人数 | 满意度占比(%) |
|---|---|---|
| 艺术 | 80 | 75 |
| 音乐 | 200 | 50 |
决策: 哪项比较同时考虑了样本量?
选择一项答案。
难度 1/5 · 今日首次完成可获 100 金币及少量额外奖励
艺术课程的满意受访者为80×75% = 60人;音乐课程为200×50% = 100人。不同样本的占比不可直接相加。应分别比较计数与比例。
原始教学数据——区域产出:
| 年份 | 产出指数(2010 = 100) |
|---|---|
| 2010 | 100 |
| 2020 | 150 |
决策: 哪项描述符合指数定义?
选择一项答案。
难度 1/5 · 今日首次完成可获 100 金币及少量额外奖励
指数表示相对于基期的变化,而非产品数量或货币总额。增长率为50/100 = 50%,而非150%。在引言中保留基准年份标签。
原始教学数据——三个地点的月降雨量:
| 地点 | 六月降雨量(毫米) |
|---|---|
| 山丘 | 120 |
| 海岸 | 80 |
| 山谷 | 40 |
决策: 哪项概述避免了无依据的解释?
选择一项答案。
难度 1/5 · 今日首次完成可获 100 金币及少量额外奖励
该表对三个六月的读数进行了排名。未显示其他月份、天气成因及随时间变化的情况。静态比较可以清晰明了,无需臆造趋势或原因。
原始教学数据 — 访客来源占比:
| 来源 | 2020 (%) | 2025 (%) |
|---|---|---|
| 本地 | 50 | 50 |
| 国内其他地区 | 30 | 35 |
| 海外 | 20 | 15 |
判断: 哪一项主要特征得到支持?
请选择一个答案。
难度 1/5 · 今日首次完成可获 100 金币及少量额外奖励
本地占比维持在50%;国内非本地占比从30升至35,海外占比从20降至15。由于缺少总数,仅凭本地占比稳定不能推断出人数稳定。海外占比远低于一半。
原始教学数据 — 分类回收材料:
| 材料 | 收集量(吨) |
|---|---|
| 纸张 | 40 |
| 玻璃 | 30 |
| 金属 | 20 |
判断: 备注说明未列出其他材料。哪项陈述是稳妥的?
请选择一个答案。
难度 1/5 · 今日首次完成可获 100 金币及少量额外奖励
纸张在展示的分类中位居首位。其总和为90吨,但由于未列出的分类存在,全市总量未知。无法由此推导出所有材料的百分比,也无法得出没有塑料的结论。
原始教学数据 — 自行车拥有情况:
| 家庭类型 | 2015 (%) | 2025 (%) |
|---|---|---|
| 无自行车 | 40 | 20 |
| 一辆自行车 | 40 | 40 |
| 两辆及以上 | 20 | 40 |
判断: 哪项概述能区分家庭类型与自行车数量?
请选择一个答案。
难度 1/5 · 今日首次完成可获 100 金币及少量额外奖励
无自行车家庭占比从40降至20;拥有两辆及以上自行车的家庭占比从20升至40。开放式类别和未知家庭总数导致无法得出精确的自行车数量。拥有一辆自行车的家庭比例保持在40%。
原始教学数据——池塘深度观察:
| 月份 | 深度(米) |
|---|---|
| 一月 | 2 |
| 四月 | 3 |
| 七月 | 2.5 |
| 十月 | 2 |
判断: 哪一幅总体描述是准确的?
请选择一个答案。
难度 1/5 · 今日首次完成可获 100 金币及少量额外奖励
相等的端点并不能消除上升至3及随后的下降。一月至四月是上升了50%,而非翻倍。报告中间模式以及不变的端点。
原始教学数据——按现行价格计算的企业销售额:
| 年份 | 名义销售额(千英镑) |
|---|---|
| 2020 | 200 |
| 2025 | 240 |
判断: 哪项声明在所提供的度量范围内成立?
请选择一个答案。
难度 1/5 · 今日首次完成可获 100 金币及少量额外奖励
40/200 = 20%的名义增长率。在没有价格或数量信息的情况下,实际增长、商品数量和价格变动无法区分。应保留“按现行价格”的限定词,而不是默默报告实际增长。
原始教学数据——两条生产线:
| 生产线 | 每小时产量(单位) | 运行时长(小时) |
|---|---|---|
| A | 30 | 4 |
| B | 20 | 8 |
判断: 哪项比较正确地区分了速率与总产量?
请选择一个答案。
难度 1/5 · 今日首次完成可获 100 金币及少量额外奖励
A生产30×4 = 120个单位;B生产20×8 = 160个单位。A每小时更快,而B较长的运行时间带来了更多的总产量。不要将速率相加以获得总数。
原始教学数据——2025年各年龄段互联网使用情况:
| 年龄组 | 使用互联网的比例(%) |
|---|---|
| 18–29 | 95 |
| 30–49 | 90 |
| 50–69 | 70 |
判断: 哪项陈述正确描述了横截面数据?
请选择一个答案。
难度 1/5 · 今日首次完成可获 100 金币及少量额外奖励
单一年份表格比较的是不同群体,而非同一人群随时间的变化。它提供的是百分比而非群体规模。横截面年龄模式不能确立个体变化或逐年增长。
原始教学数据——年度公交与铁路出行次数:
| 年份 | 公交(百万次) | 铁路(百万次) |
|---|---|---|
| 2015 | 30 | 20 |
| 2020 | 25 | 25 |
| 2025 | 20 | 30 |
判断: 哪个概述准确反映了变化关系?
选择一项答案。
难度 1/5 · 今日首次完成可获 100 金币及少量额外奖励
公交走势为30→25→20,铁路走势为20→25→30。两者在所示的2020观测值处相等,最终排名发生逆转。最终比率为30/20 = 1.5,并非2。请勿虚构未观察到的交叉点日期。
One table, three decisions
- Three questions use one library-loans table: choose an overview, choose supporting details, and spot an unsupported addition. Reread the units and dates for each question.
- A good report doesn't calculate every possible ratio. Choose the comparisons that show the main pattern, keep the overview consistent with them, and leave out explanations the table doesn't give. Next, you write the report yourself.
原始教学数据——马什图书馆借阅量(共用来源):
| 年份 | 数字借阅(千次) | 纸质借阅(千次) |
|---|---|---|
| 2016 | 20 | 80 |
| 2020 | 40 | 70 |
| 2024 | 60 | 60 |
判断: 哪个概述涵盖了主要关系?
选择一项答案。
难度 1/5 · 今日首次完成可获 100 金币及少量额外奖励
数字借阅走势为20→40→60;纸质借阅走势为80→70→60。两者最终总量持平;合计总量分别为100、110和120,因此并非常数。这是用于三次规划决策的一个共用来源。
原始教学数据——马什图书馆借阅量(共用来源):
| 年份 | 数字借阅(千次) | 纸质借阅(千次) |
|---|---|---|
| 2016 | 20 | 80 |
| 2020 | 40 | 70 |
| 2024 | 60 | 60 |
判断: 哪项细节支持该概述?
选择一项答案。
难度 1/5 · 今日首次完成可获 100 金币及少量额外奖励
80−20 = 60千笔;最终60−60 = 0千笔。数字贷款占比从20/100 = 20%升至60/120 = 50%,变动了30个百分点。数字贷款数量增长40/20 = 200%,而纸质贷款下降。请区分计数与占比。
原始教学数据 — 马什图书馆借阅量(共享来源):
| 年份 | 数字借阅(千次) | 纸质借阅(千次) |
|---|---|---|
| 2016 | 20 | 80 |
| 2020 | 40 | 70 |
| 2024 | 60 | 60 |
决策: 哪句建议句子因缺乏证据应被删除?
选择一项答案。
难度 1/5 · 今日首次完成可获 100 金币及少量额外奖励
未提供应用或原因信息。将20乘以三得60;印刷类减少80−60 = 20;总量从100增至120。其余陈述有效,但报告仍需筛选归类而非罗列所有内容。
Write a full report: the ferry table
- Write your own report on the ferry table before you look at the models. The real task asks for at least 150 words in about 20 minutes. Practise untimed first if you like, then try it timed. Plan in notes; write in paragraphs.
- Then compare the weaker and the improved model. Check what each paragraph does and whether every statement matches the table. Fix one selection, grouping or accuracy problem in your own report. Your draft stays only on this page, so copy it if you want to keep it.
原始学术任务1教学数据 — 年度乘客行程(百万人次),三条渡轮航线,2010–2025:
| 年份 | 北线 | 东线 | 南线 |
|---|---|---|---|
| 2010 | 60 | 30 | 20 |
| 2015 | 55 | 40 | 20 |
| 2020 | 45 | 50 | 25 |
| 2025 | 40 | 60 | 30 |
用连贯的散文至少写150词。概括主要特征并进行相关比较。在打开范文前先起草,然后修改一个主要特征、证据或分组方面的弱点。此本地页面不进行评分或自动强制执行字数要求。您的草稿保留在此页面;离开前请复制它。
比较证据与段落功能,而非匹配短语。多个报告均可满足任务要求。本清单不自动评估写作、评定能力或分配分数等级。所有数字与资格代码请回归原文核实。
A second report: one year, several facilities
- The library-centres tables need a different report from the ferry trend. Keep the visit numbers separate from the facility counts, and plan your own overview — don't reuse a trend sentence that fitted the last task. Write at least 150 words before you look at the models.
- Use the notes on the models to improve your own report, not to replace it with memorised sentences. If your report leaves out an important measure, fix that before polishing vocabulary.
原始学术任务1教学数据 — 2025地区图书馆中心情况:
| 中心 | 年访客量(千) | 阅读座位数 |
|---|---|---|
| Harbour | 120 | 80 |
| Meadow | 90 | 60 |
| Quarry | 60 | 40 |
| 森林 | 30 | 20 |
| 中心 | 电脑台数 |
|---|---|
| Harbour | 20 |
| Meadow | 30 |
| Quarry | 20 |
| 森林 | 10 |
用连贯文章撰写至少150词。总结主要特征并进行相关比较。打开范文前先起草,然后修改一处主要特征、证据或归类上的不足。此本地页面不进行评分或自动执行字数要求。草稿保留在此页;离开前请复制保存。
比较证据与段落功能,而非匹配短语。多个报告均可满足任务要求。本清单不自动评估写作、评定能力或分配分数等级。所有数字与资格代码请回归原文核实。
Review after a break: keep the measure and its base together
- After a day or two, try the park and music-class questions without rereading the examples. If you miss one, say exactly which column, quantity or base you confused, and rewrite that sentence correctly.
- Next: map reports, process reports, the language of change, or answering the Task 2 question. General Training learners need letters instead.
原始教学数据 — 2025年的三个公园:
| 公园 | 面积(公顷) | 年度访问量(千) |
|---|---|---|
| Alder | 10 | 90 |
| Beech | 20 | 60 |
| Cypress | 30 | 30 |
决策: 哪种比较是准确的?
选择一个答案。
难度 1/5 · 今日首次完成可获 100 金币及少量额外奖励
Alder面积最小,为10公顷,但有90千次访问量;Cypress则反转了这些排名。原文未提及原因和增长。即使两者的顺序相反,也应将面积和访问量作为独立指标分别表述。
原始教学数据 — 每周音乐课参与情况:
| 年份 | 注册学生人数 | 周出勤率(%) |
|---|---|---|
| 2021 | 400 | 25 |
| 2025 | 200 | 50 |
决策: 哪项陈述同时符合两个分母的要求?
选择一个答案。
难度 1/5 · 今日首次完成可获 100 金币及少量额外奖励
400×25% = 100,且200×50% = 100。出勤率翻倍,即上升了25个百分点;注册人数的变化阻止了相同的人数趋势。起草前请重新计算每年的数据。
An overview your details can prove
- Introduce the visual accurately, choose its main features, group meaningful comparisons and support them with correct numbers. Keep counts, shares, rates, dates and projections attached to their labels. No fixed paragraph count can make those decisions for you.
- Checked on 19 October 2026 against the IELTS Academic Writing format. All data and models in this lesson are our own teaching material; the models are not officially rated.

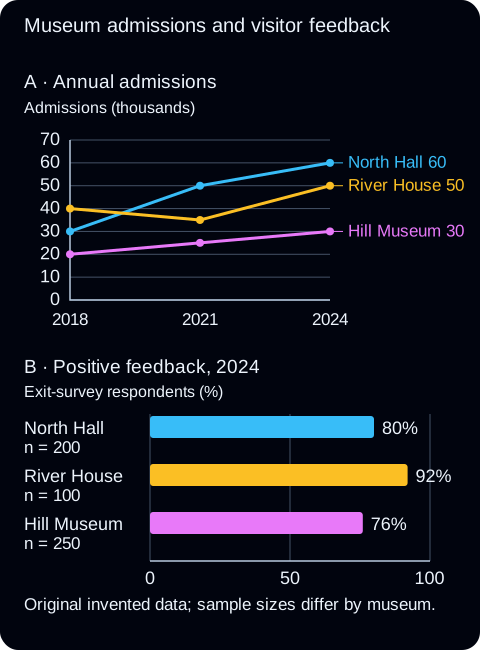
展示所提供的标签和数据
面板A — 年度入场人数。入场人数(千)。
| 博物馆 | 2018 | 2021 | 2024 |
|---|---|---|---|
| North Hall | 30 | 50 | 60 |
| River House | 40 | 35 | 50 |
| Hill Museum | 20 | 25 | 30 |
面板B — 正面反馈,2024。离店调查受访者占比(%)。原始虚构数据;各博物馆的样本量不同。
| 博物馆 | 数值 | 受访者人数 |
|---|---|---|
| North Hall | 80 | 200 |
| River House | 92 | 100 |
| Hill Museum | 76 | 250 |
初始决策: 哪一组单位能正确描述这两个面板?
难度 1/5 · 今日首次完成可获 100 金币及少量额外奖励
面板A统计的是以千为单位的入场人次,而非独立访客人数。面板B给出的是每个博物馆受访者中积极反馈所占的百分比。在合并两个面板的信息前,请分别阅读单位和基数。
Two panels: combine them without mixing units
- Worked mixed chart. North Hall's admissions rise from 30,000 to 60,000, making it the largest of the three museums in 2024. River House, however, has the highest share of positive feedback, at 92%. A good overview contrasts the two leaders; it doesn't force one panel's ranking onto the other.
- North Hall was the most successful museum in every respect ignores the feedback panel. Name the measures instead: the most admissions and the highest positive-feedback share belong to different museums. An enthusiastic therefore cannot invent a missing cause.
Show the supplied labels and data
Panel A — Annual admissions. Admissions (thousands).
| Museum | 2018 | 2021 | 2024 |
|---|---|---|---|
| North Hall | 30 | 50 | 60 |
| River House | 40 | 35 | 50 |
| Hill Museum | 20 | 25 | 30 |
Panel B — Positive feedback, 2024. Exit-survey respondents (%). Original invented data; sample sizes differ by museum.
| Museum | Value | Respondents |
|---|---|---|
| North Hall | 80 | 200 |
| River House | 92 | 100 |
| Hill Museum | 76 | 250 |
- The survey samples differ — 200, 100 and 250 respondents — so the percentages describe the people surveyed, not every visitor admitted.
显示提供的标签和数据
面板A — 年度入场人次。入场人次(千人)。
| 博物馆 | 2018 | 2021 | 2024 |
|---|---|---|---|
| 北厅 | 30 | 50 | 60 |
| 河滨馆 | 40 | 35 | 50 |
| 山丘博物馆 | 20 | 25 | 30 |
面板B — 积极反馈,2024。离场调查受访者占比(%)。原始虚构数据;各博物馆样本量不同。
| 博物馆 | 数值 | 受访者 |
|---|---|---|
| 北厅 | 80 | 200 |
| 河滨馆 | 92 | 100 |
| 山丘博物馆 | 76 | 250 |
引导式判断: 哪一个跨面板概览得到了支持?
难度 1/5 · 今日首次完成可获 100 金币及少量额外奖励
北厅在2024年有60千名入学人数,高于河屋的50和山丘博物馆的30。河屋在反馈份额方面领先,达92%,相比之下分别为80%和76%。这些排名可以对比;但图表并未建立因果关系,也未证明调查样本代表所有入学人数。
Check each panel's dates before describing a trend
- In a new two-panel display, note each panel's dates and unit before writing. A visits line covering several years doesn't turn a one-year bar chart of opening hours into a trend.
- Try the centre question before reading its explanation, and check each claim against both panels.

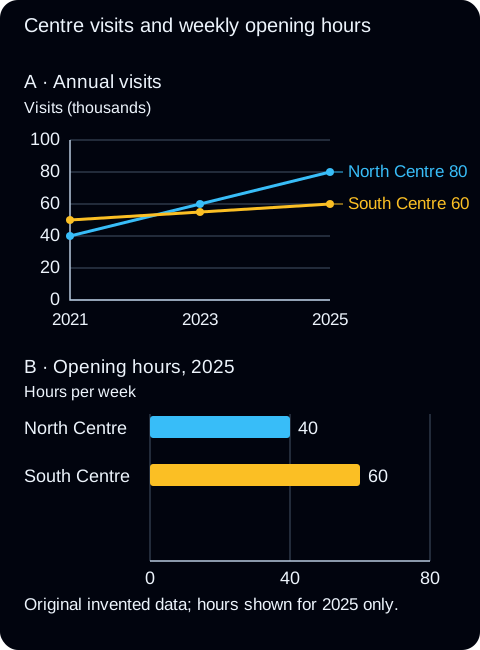
显示提供的标签和数据
面板A — 年度访问量。访问量(千人)。
| 中心 | 2021 | 2023 | 2025 |
|---|---|---|---|
| 北中心 | 40 | 60 | 80 |
| 南中心 | 50 | 55 | 60 |
面板B — 开放时间,2025。每周小时数。原始虚构数据;仅显示了2025的小时数。
| 中心 | 数值 |
|---|---|
| 北中心 | 40 |
| 南中心 | 60 |
全新独立判断: 哪一项陈述报告了两个面板的信息而未超出其证据范围?
难度 1/5 · 今日首次完成可获 100 金币及少量额外奖励
北线在2025年的访问量为80千次,而南线为60千次,每周开放时间为40小时对比60小时。时间序列显示的是访问量而非历史开放时间,因此未提供开放时间趋势。不同最终年份的排名并不能证明开放时间是导致访问模式的原因。
Write a full report on a mixed chart
- Write your own report on the ferry display below. Keep passenger journeys separate from percentages of departures: a journey and a departure are different things to count.
- Then open the weaker and improved comparison, find one inaccurate claim in your own report, and fix it. Other organisations can work; the model is an example, not a script to memorise.

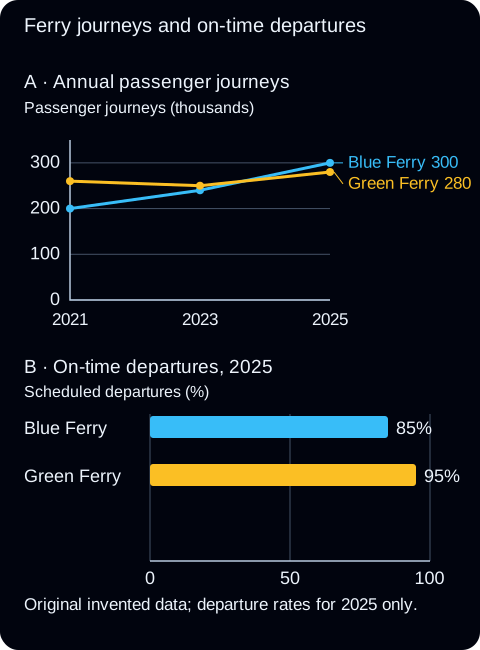
显示提供的标签和数据
面板A — 年度旅客航程。旅客航程(千人)。
| 运营商 | 2021 | 2023 | 2025 |
|---|---|---|---|
| 蓝渡轮 | 200 | 240 | 300 |
| 绿渡轮 | 260 | 250 | 280 |
面板B — 准时出发,2025。计划出发班次占比(%)。原始虚构数据;仅显示了2025的出发率。
| 运营商 | 数值 |
|---|---|
| 蓝渡轮 | 85 |
| 绿渡轮 | 95 |
新语境书面转化: 撰写一篇英语学术任务1练习报告,字数不少于150字,采用连贯的段落形式。描述两个图表,选择一张主图,并使用提供的数据进行相关比较。请先尝试撰写自己的报告,然后再检查日期、单位和基数后修订一个跨面板的声明。这种本地自我审查不产生分数估算。
使用范文和标准来比较并修订您的报告;多种组织结构都是有效的。这记录的是书面自我审查,而非独立评估或雅思成绩。
Remember the method, then use it somewhere new
- Tomorrow, go back to one of the displays and write an overview without the model, checking which panel supports each part. A few days later, try another display and explain one cross-panel claim its data can't support.
- Next: the language of change, map reports or process reports. General Training uses letters.
- Checked on 20 October 2026 against the IELTS Academic Writing format. All displays and reports are our own practice material.