Population, urban systems and indicators
引入| English | 释义 | 拼音 |
|---|---|---|
| immigration/ˌɪmɪˈɡreɪʃn/ | 迁入 | qiān rù |
| emigration/ˌemɪˈɡreɪʃn/ | 迁出 | qiān chū |
| indicator/ˈɪndɪkeɪtə/ | 指标 | zhǐ biāo |
| doubling time/ˈdʌblɪŋ taɪm/ | 倍增时间 | bèi zēng shí jiān |
| total fertility rate/ˈtəʊtl fɜːˈtɪlɪti reɪt/ | 总和生育率 | zǒng hé shēng yù lǜ |
| age-sex pyramid | 人口金字塔 | rén kǒu jīn zì tǎ |
| pronatalist | 鼓励生育 | gǔ lì shēng yù |
| carrying capacity/ˈkæriɪŋ kəˈpæsɪti/ | 承载力 | chéng zài lì |
| urbanisation/ˌɜːbənaɪˈzeɪʃn/ | 城市化 | chéng shì huà |
| push factor/pʊʃ ˈfæktə/ | 推力因素 | tuī lì yīn sù |
| pull factor | 拉力因素 | lā lì yīn sù |
| counter-urbanisation | 逆城市化 | nì chéng shì huà |
| informal settlement | 非正规住区 | fēi zhèng guī zhù qū |
| primary pollutant | 一次污染物 | yī cì wū rǎn wù |
| secondary pollutant | 二次污染物 | èr cì wū rǎn wù |
| acid deposition | 酸沉降 | suān chén jiàng |
What would explain this observation?
- A city can grow because people move into it even when births equal deaths. Population change has several flows.
Build the model
- Population change depends on births, deaths, immigration 迁入 and emigration.
- Urban systems exchange energy, materials and waste with a wider region.
- A sustainability indicator 指标 measures a specified feature rather than total wellbeing.
- immigration: Movement into a population.
- indicator: A measure of a specified condition.

Which contributes positively to population change?
难度 1/5 · 今日首次完成可获 100 金币及少量额外奖励
Immigration adds people to a population, so it contributes positively; emigration and deaths remove people. Births and immigration are the two positive terms in the population balance.
Match each technical term to its precise meaning.
难度 2/5 · 今日首次完成可获 140 金币及少量额外奖励
Use the definitions to distinguish related quantities and processes.
A population of 5,000 has 90 births, 40 deaths, 30 immigrants and 30 emigrants. What is the percentage growth, and which flows does population change include?
Percentage growth is the population change divided by the starting population. The change uses all four flows.
A population starts at 5000. During one year it records 90 births, 40 deaths, 30 immigrants and 30 emigrants. What is its percentage growth relative to the starting population?
难度 1/5 · 今日首次完成可获 100 金币及少量额外奖励
Population change = births − deaths + immigration − emigration = 90 − 40 + 30 − 30 = 50 people. Percentage growth = 50/5000 × 100 = 1% in the year. Neither the change of 50 people nor the 90 births is a percentage.
Choose evidence that can test it
- Compare rates with a common denominator and interval.
- An average can hide unequal access to services.
- At HL, evaluate how economic incentives, legal responsibilities and ethical priorities change an urban management proposal.
In the lab: Use published demographic and city-service data with dates and definitions. Protect privacy when collecting local opinions. Compare the same geographical boundary rather than mixing an urban core with a whole metropolitan region.
Which two habits make the investigation or model in this case more defensible?
难度 2/5 · 今日首次完成可获 140 金币及少量额外奖励
Stating the conditions and assumptions lets others repeat the work exactly, and recording the supporting evidence lets them check the conclusion. Hiding disagreeing results removes the evidence that could challenge a wrong conclusion, and one measurement can never establish a wider claim.
Which pair adds people?
难度 1/5 · 今日首次完成可获 100 金币及少量额外奖励
Population change equals births minus deaths plus immigration minus emigration.
Work from known quantities
- Known: a city has 10,000 people; births 150, deaths 100, immigration 300 and emigration 200 in one year.
- Change = 150-100+300-200 = 150.
- Growth percentage = 150/10,000×100 = 1.5%.
Your turn: A population of 2,000 grows by 40 in a year. Find percentage growth.
A population of 2,000 grows by 40 in a year. Find percentage growth.
难度 2/5 · 今日首次完成可获 140 金币及少量额外奖励
The result is 2 %. Known: population 2,000; growth 40 in a year. Use percentage growth = change / population x 100. Growth = 40/2,000 x 100 = 2% per year. The balance of births, deaths and migration produces that change.
A town starts with 10000 people. Over one year it records 150 births, 100 deaths, 300 immigrants and 200 emigrants. What is total annual percentage growth?
难度 1/5 · 今日首次完成可获 100 金币及少量额外奖励
Change = 150 − 100 + 300 − 200 = 150 people. Growth = 150/10000 × 100 = 1.5% over the year. Natural increase alone is 50/10000 × 100 = 0.5%; it excludes migration.
Check the conclusion and its limits
- A projected population is conditional on assumptions.
- Urban growth does not automatically mean improved health, income or environmental quality for every resident.
Not true: Population growth depends only on births and deaths. Population change = births - deaths + immigration - emigration. A country with more deaths than births can still grow through net immigration, so births and deaths alone do not decide it.
- Population change depends on births, deaths, immigration and emigration.
- Compare rates with a common denominator and interval.
- Watch for: A projected population is conditional on assumptions.
Population change = births - deaths + immigration - emigration.
难度 1/5 · 今日首次完成可获 100 金币及少量额外奖励
True. Population change = births - deaths + immigration - emigration. A country with more deaths than births can still grow through net immigration, so births and deaths alone do not decide it.
Movement into a population: write the technical term.
难度 1/5 · 今日首次完成可获 100 金币及少量额外奖励
immigration means Movement into a population.
A town has a crude birth rate of 15 and crude death rate of 10, both per 1000 people per year. What is its natural increase rate as an annual percentage?
难度 1/5 · 今日首次完成可获 100 金币及少量额外奖励
Natural increase = 15 − 10 = 5 people per 1000 per year. Convert to percent: 5/1000 × 100 = 0.5% per year. Net migration is excluded from natural increase.
Write from 1 percent growth
- A population of 5,000 has 90 births, 40 deaths, 30 immigrants and 30 emigrants in one year.
- Find the percentage growth. Population change is not births and deaths alone.
The rule of 70 gives an estimated doubling time of 28 years at annual population growth of 2.5%. Under what condition does this estimate apply?
难度 1/5 · 今日首次完成可获 100 金币及少量额外奖励
Doubling time ≈ 70/2.5 = 28 years if approximately 2.5% annual growth persists. The rule approximates constant exponential growth and does not predict changing rates.
Separate people from rates
- Births and immigration 迁入 add people; deaths and emigration 迁出 remove them. Count every flow over the same year and population boundary.
- A population can grow with more deaths than births if net inward migration is large enough.
Does period TFR below 2.1 guarantee immediate decline?
难度 1/5 · 今日首次完成可获 100 金币及少量额外奖励
Replacement is conditional, while the present age structure influences births.
Balance the invented town
- A town starts with 10 000 people and records 150 births, 100 deaths, 300 arrivals and 200 departures in a year.
- Change =150−100+300−200=150; growth=150/10 000×100=1.5%. Natural increase alone is only 50 people.
What characterises the simplified stage 2?
难度 1/5 · 今日首次完成可获 100 金币及少量额外奖励
The widening birth/death gap creates natural increase.
Calculate crude rates
- Crude birth and death rates count births or deaths per 1000 people per year, using a stated population estimate.
- For the invented town, CBR=15 and CDR=10 per 1000 per year. Natural increase=(15−10)/10=0.5% per year.
What is a defensible use of the DTM?
难度 1/5 · 今日首次完成可获 100 金币及少量额外奖励
A schematic model is a starting point for evidence, not a fixed path.
Use doubling time 倍增时间 conditionally
- The rule of 70 estimates doubling time as 70 divided by a positive annual percentage growth rate.
- At 2.5% growth,70/2.5=28 years. Changing rates or negative growth invalidate a simple fixed doubling date.
What can a pyramid directly show?
难度 1/5 · 今日首次完成可获 100 金币及少量额外奖励
Age structure is visible; causal and employment claims require other evidence.
Interpret fertility and replacement
- Period total fertility rate 总和生育率 applies current age-specific birth rates to a hypothetical reproductive lifetime; it is not every woman’s completed family size.
- Replacement is often about 2.1 in low-mortality populations, with allowances for survival and sex ratio. Migration and age structure also change totals.
Which makes a policy evaluation stronger?
难度 1/5 · 今日首次完成可获 100 金币及少量额外奖励
Policy effect, wider trends and human costs require separate evidence.
Read the demographic transition
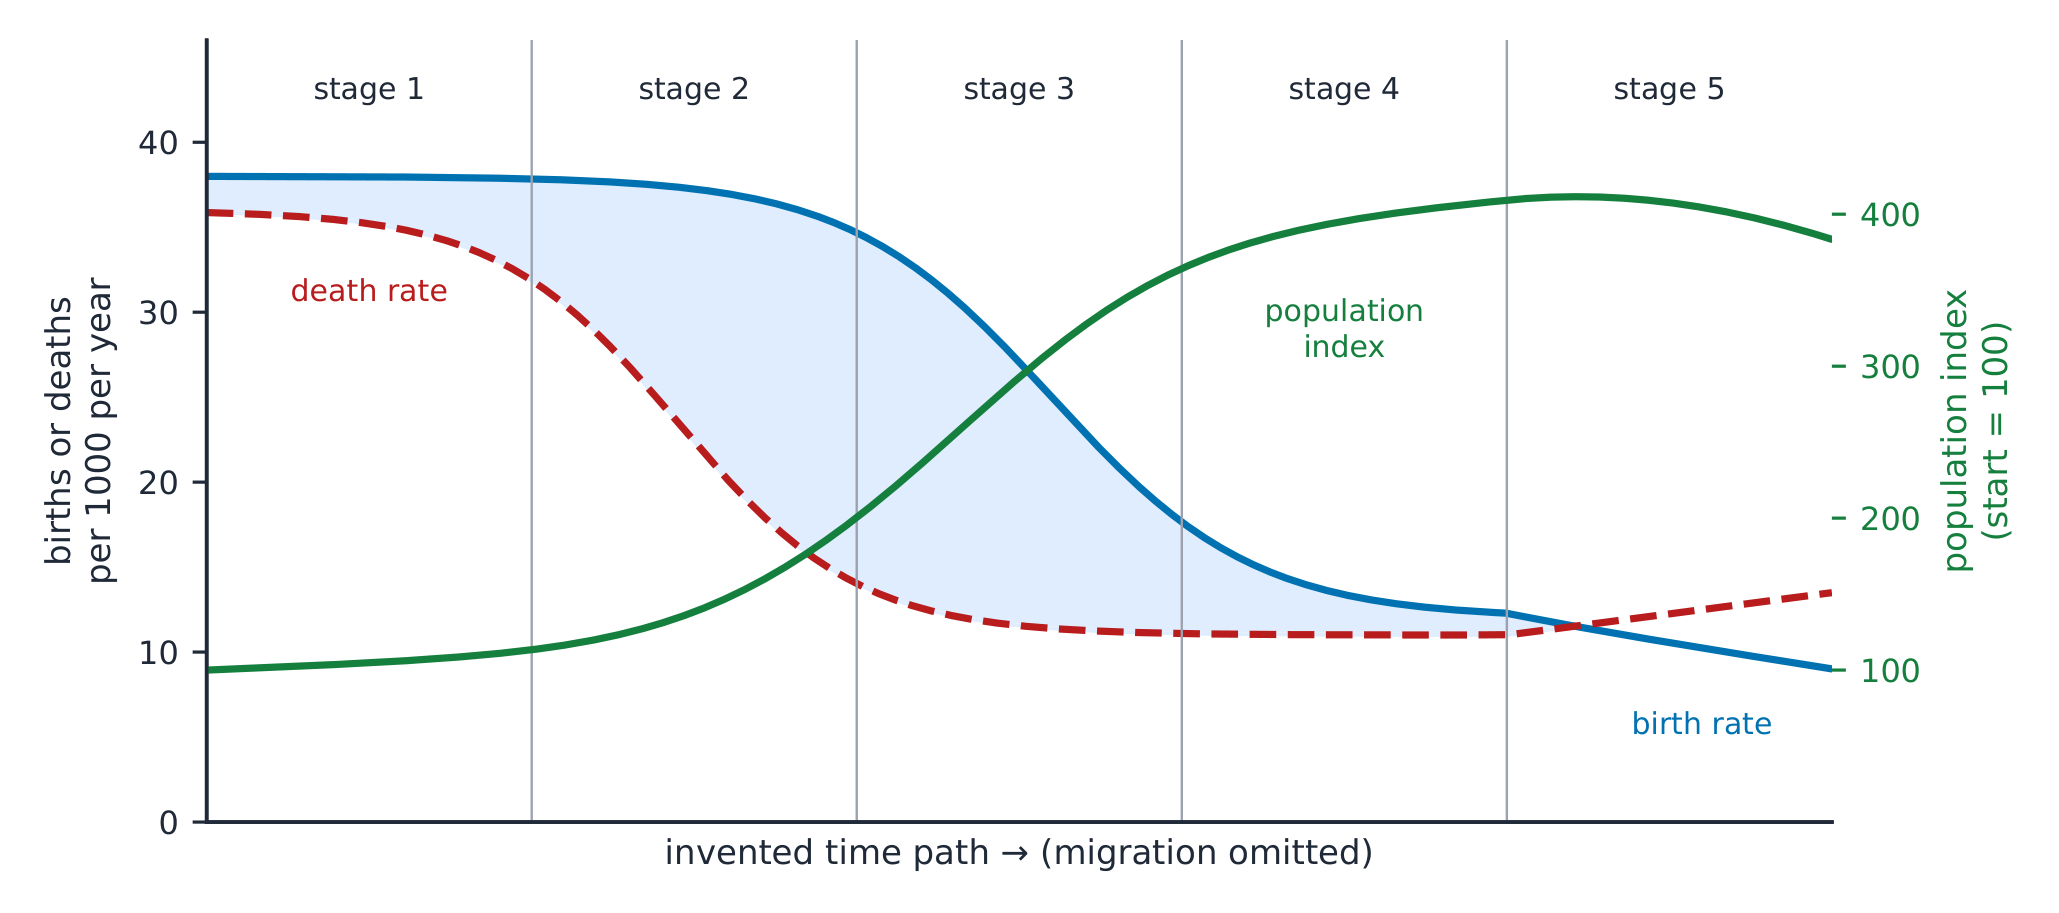
- In a simplified stage 2, death rates fall while birth rates remain high; natural increase becomes large. Stage 3 has falling birth rates and slower increase.
- Sanitation, nutrition and healthcare can lower deaths; autonomy, contraception, survival and changing costs can influence births. These are interacting mechanisms.
Does an education–fertility correlation prove one cause?
难度 1/5 · 今日首次完成可获 100 金币及少量额外奖励
Individual choices and multiple interacting factors affect fertility.
Recognise model limits
- The DTM summarises historical patterns; it does not assign permanent country ranks or universal transition dates.
- Migration, shocks, policies and within-country differences matter. A fifth stage describes possible natural decrease rather than an inevitable destination.
Which fits Boserup’s argument?
难度 1/5 · 今日首次完成可获 100 金币及少量额外奖励
Boserup proposes a response mechanism, not unlimited cost-free growth.
Read age structure carefully
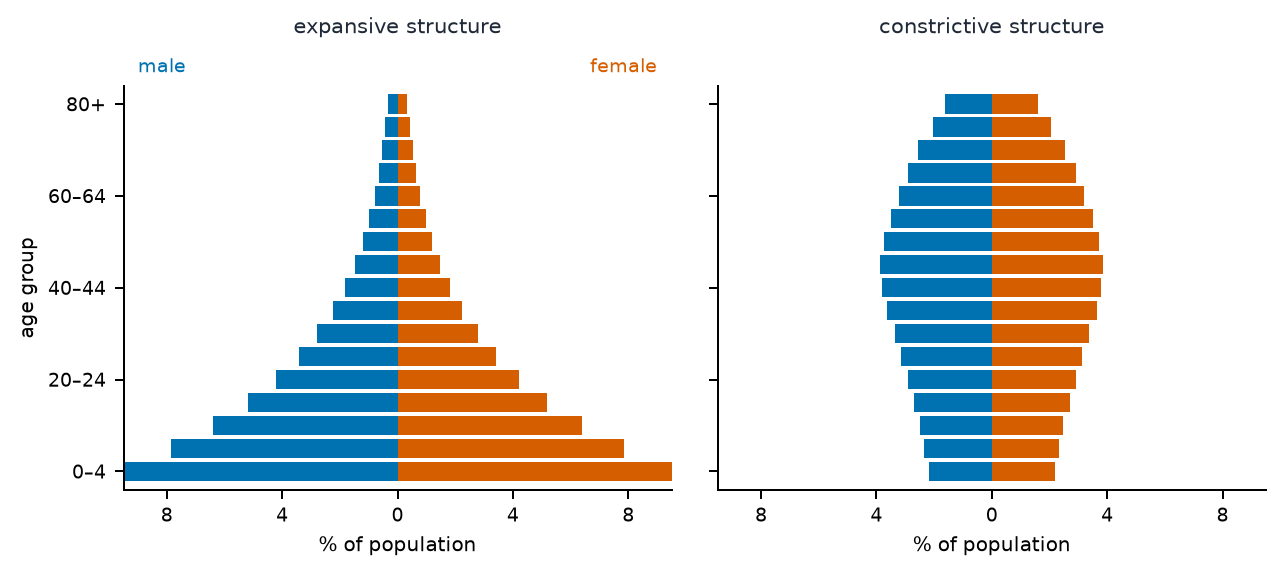
- Age-sex pyramids 人口金字塔 show numbers or percentages in labelled age bands. Compare the same scale and denominator.
- A broad young base indicates relatively large young cohorts; births, survival and migration can all affect the shape. The picture alone does not measure life expectancy.
Can population alone determine total environmental impact?
难度 1/5 · 今日首次完成可获 100 金币及少量额外奖励
Define the impact rather than treating all environmental effects as one interchangeable quantity.
Compare population policies
- China moved from birth restrictions towards two-child and then three-child policies; evaluate reproductive rights and other drivers as well as totals.
- Singapore’s Baby Bonus is a dated pronatalist 鼓励生育 example; its official service announces transition to a new child-support package. Financial help alone does not isolate a fertility effect.
What defines urbanisation here?
难度 1/5 · 今日首次完成可获 100 金币及少量额外奖励
Always compare the urban numerator with the same defined total denominator.
Explain indirect demographic effects
- Bangladesh’s education and employment changes occurred alongside family-planning services. Kerala combines education, public health and child-survival improvements.
- These named examples show how development may alter opportunities and desired family size. Neither proves schooling alone caused a national fertility trend.
A district initially has 60000 urban residents out of 100000 total. Later it has 66000 urban residents out of 120000 total. What is the final urban share?
难度 1/5 · 今日首次完成可获 100 金币及少量额外奖励
Final urban share = 66000/120000 × 100 = 55%. Initial share = 60000/100000 × 100 = 60%. Urban numbers rose, but the share fell by 5 percentage points because the total grew faster.
Find urban share as a percentage for 66 000 urban residents out of 120 000 total.
难度 2/5 · 今日首次完成可获 140 金币及少量额外奖励
66 000/120 000×100=55%.
Compare Malthus and Boserup
- Malthus emphasised population pressure on food supply; Boserup emphasised innovation stimulated by pressure.
- Innovation can raise yields, but resource limits, distribution and environmental costs remain. Neither view is a guaranteed forecast.
Is counter-urbanisation identical to suburbanisation?
难度 1/5 · 今日首次完成可获 100 金币及少量额外奖励
The destination and settlement relationship define the distinction.
Define environmental impact
- IPAT connects population, consumption per person and impact per consumed unit when units and boundaries fit.
- A footprint estimates demand on biologically productive area under one accounting method. It does not measure every pollutant or specify one fixed carrying capacity 承载力.
Which is an output from the defined city system?
难度 1/5 · 今日首次完成可获 100 金币及少量额外奖励
Direction depends on the stated boundary; transformations and stores occur inside.
Distinguish urban growth from urbanisation 城市化
- Urban growth means increasing urban numbers or built area. Urbanisation means an increasing urban share of the whole population.
- Natural increase, migration and reclassification can change totals; a new administrative boundary is not automatically physical growth.
Which change can increase rapid storm runoff?
难度 1/5 · 今日首次完成可获 100 金币及少量额外奖励
Water that cannot infiltrate or be stored can flow quickly into drainage.
Calculate an urban share
- Invented district: total population 100 000→120 000 and urban population 60 000→66 000. Urban numbers rise 10%.
- Urban shares are 60% and 55%. This is urban growth with a falling urban share, so it is not urbanisation under this definition.
For the same storm and equal site areas, modelled runoff is 8000 m³ at a sealed site and 3000 m³ at a vegetated site. What is sealed minus vegetated runoff?
难度 1/5 · 今日首次完成可获 100 金币及少量额外奖励
Runoff difference = 8000 − 3000 = 5000 m³. Both are volumes for the same event and equal areas; the result depends on the assigned runoff model.
In an invented storm, 10 mm of rain falls on each of two 1 km² sites. Runoff fractions are 0.8 for the sealed site and 0.3 for the vegetated site. Find sealed minus vegetated runoff volume in cubic metres.
难度 2/5 · 今日首次完成可获 140 金币及少量额外奖励
Rain depth = 10/1000 = 0.010 m; area = 1000000 m². Rain volume per site = 0.010 × 1000000 = 10000 m³. Runoff volumes = 10000 × 0.8 = 8000 m³ and 10000 × 0.3 = 3000 m³. Difference = 8000 − 3000 = 5000 m³ under the assigned model.
Explain movement within settlements
- Rural push factors 推力因素 can include insecure livelihoods or drought; urban pull factors 拉力因素 can include jobs, healthcare and education. Choices and constraints differ.
- Suburbanisation moves towards urban edges; counter-urbanisation 逆城市化 moves away from larger urban areas towards smaller settlements or rural places. Neither is limited to wealthy countries.
Which belongs in an urban sustainability evaluation?
难度 1/5 · 今日首次完成可获 100 金币及少量额外奖励
A plan must serve people and ecosystems rather than optimise one visible feature.
Trace an open city system
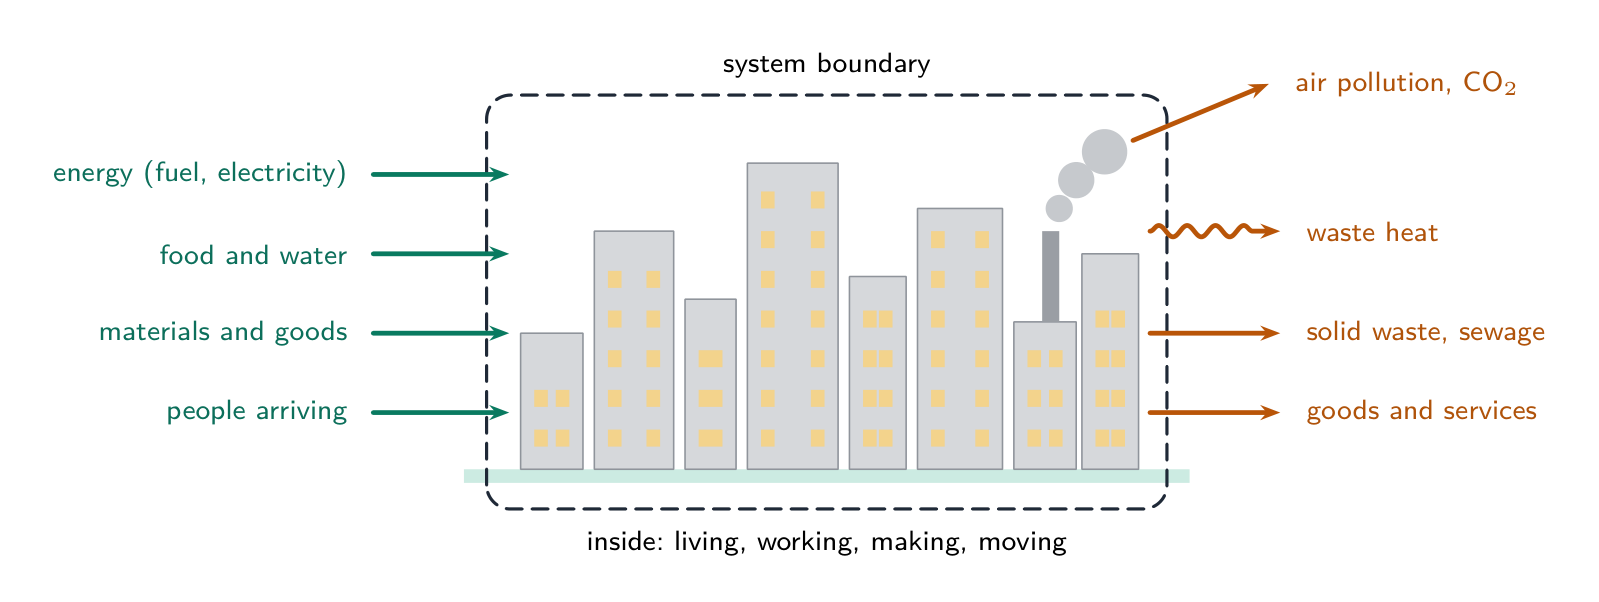
- Cities import energy, water, food, materials and people and export products, waste, sewage and heat. State the boundary and time interval.
- A city contains biotic components such as plants and animals and abiotic components such as soils, air, water and buildings; it is an ecosystem as well as infrastructure.
Why combine measures?
难度 1/5 · 今日首次完成可获 100 金币及少量额外奖励
Systems thinking connects benefits, costs and constraints across sectors.
Explain urban environmental change
- Sealed surfaces speed runoff; habitat loss and fragmentation reduce ecological connections. Heat storage, reduced vegetation and waste heat can warm urban areas.
- Effects depend on season, weather, materials and land cover. A heat-island average does not mean every urban site is always warmer.
What can a design target demonstrate by itself?
难度 1/5 · 今日首次完成可获 100 金币及少量额外奖励
Measured use and distribution determine whether intended benefits occur.
Work through an invented storm
- Ten millimetres of rain over 1 square kilometre gives 0.010×1 000 000=10 000 cubic metres of rain.
- At runoff fractions 0.8 and 0.3, sealed and vegetated sites yield 8000 and 3000 cubic metres. This simple model omits many real site processes.
What makes a before/after map comparison valid?
难度 1/5 · 今日首次完成可获 100 金币及少量额外奖励
Spatial evidence needs consistent measurement and supporting social/ecological observations.
Meet needs through a plan
- Planning connects housing, employment, commerce, transport, finance, education and health with environmental quality.
- Informal settlements 非正规住区 vary; do not assume all lack the same services. Include secure tenure, affordability, accessibility and meaningful resident participation.
Should PM2.5 and PM10 be added as disjoint size categories?
难度 1/5 · 今日首次完成可获 100 金币及少量额外奖励
The categories are nested aerodynamic size fractions.
Connect sustainable measures
- Frequent public transport and safe walking can reduce car dependence. Efficient buildings reduce energy demand; water-sensitive design manages runoff.
- Green roofs, wetlands and urban farming can provide several functions but require suitable conditions and maintenance. Planting alone does not guarantee biodiversity or safety.
Which is a secondary pollutant?
难度 1/5 · 今日首次完成可获 100 金币及少量额外奖励
Formation after emission distinguishes secondary pollution.
Use Freiburg as a named example
- Vauban in Freiburg combines redevelopment, transport access, cycling and efficient buildings; municipal documentation distinguishes low-energy and passive-house buildings.
- Do not say every home has one identical standard. Test actual travel, comfort, embodied and operating energy, affordability and accessibility.
Which is wet deposition?
难度 1/5 · 今日首次完成可获 100 金币及少量额外奖励
The delivery process distinguishes wet from dry deposition.
Read maps and indicators 指标
- Use dated maps with matching boundaries, scale and legends; examine built area, habitats, fragmentation and permeable surfaces.
- Indicators such as exposure, travel access and sanitation measure specified features. A city mean can hide district differences, so combine ecological, service and resident evidence.
Why can two lakes respond differently to similar deposition?
难度 1/5 · 今日首次完成可获 100 金币及少量额外奖励
Sensitivity depends on chemical buffering and ecological conditions.
Classify emissions and particles
- Primary pollutants 一次污染物 are emitted directly: examples include CO, NOx, SO₂, soot and dust. Natural fires, dust and volcanoes also emit pollutants.
- PM2.5 includes particles up to 2.5 micrometres; it is a subset of PM10, which extends to 10 micrometres. Small particles can reach deeply into lungs.
What does liming mainly address?
难度 1/5 · 今日首次完成可获 100 金币及少量额外奖励
Restoration and prevention have different mechanisms.
Recognise secondary pollution
- Secondary pollutants 二次污染物 form in the atmosphere: ozone, acids and some sulfate/nitrate particles. Not every particle is primary.
- Emissions are amounts released per time; concentrations depend on mixing, chemistry, transport and weather. Natural origin does not mean harmless.
What can a lichen association with distance establish alone?
难度 1/5 · 今日首次完成可获 100 金币及少量额外奖励
An indicator integrates conditions and needs other evidence for causal attribution.
Follow acid deposition 酸沉降
- SO₂ and nitrogen oxides can be oxidised and form acids. A balanced net summary is 2 SO₂+O₂+2 H₂O→2 H₂SO₄; this is not one elementary reaction.
- Wet deposition arrives with rain, fog or snow; dry deposition involves gases and particles without precipitation. Pollution can travel downwind across borders.
Can meeting one national annual limit prove zero health risk?
难度 1/5 · 今日首次完成可获 100 金币及少量额外奖励
Maintain pollutant, averaging period and benchmark when comparing values.
Explain acid damage
- Acidity can mobilise aluminium and remove nutrient ions from soils, harm roots and affect aquatic organisms. Bedrock buffering changes sensitivity.
- Limestone buildings can weather; nitrogen deposition may also alter nutrient supply and species balance. Equal emissions do not guarantee equal ecosystem damage.
Which strengthens evaluation?
难度 1/5 · 今日首次完成可获 100 金币及少量额外奖励
Multiple measurements and alternative explanations help assess effectiveness.
Choose the management level
- Change activity through cleaner energy and transport; control releases with suitable scrubbers, catalysts or particle collectors; restore damaged systems where feasible.
- Liming can treat acidity but does not stop emissions. Health warnings and indoor filters manage exposure rather than clean the outdoor atmosphere.
Investigate lichens safely
- Use equal quadrats and repeated observations on comparable trees along a defined road-distance gradient, plus background sites. Protect organisms and avoid deliberate exhaust exposure.
- Record species, bark pH, height, aspect, shade and moisture. These can confound a lichen pattern; compare calibrated pollution records where available.
Interpret Beijing’s annual means
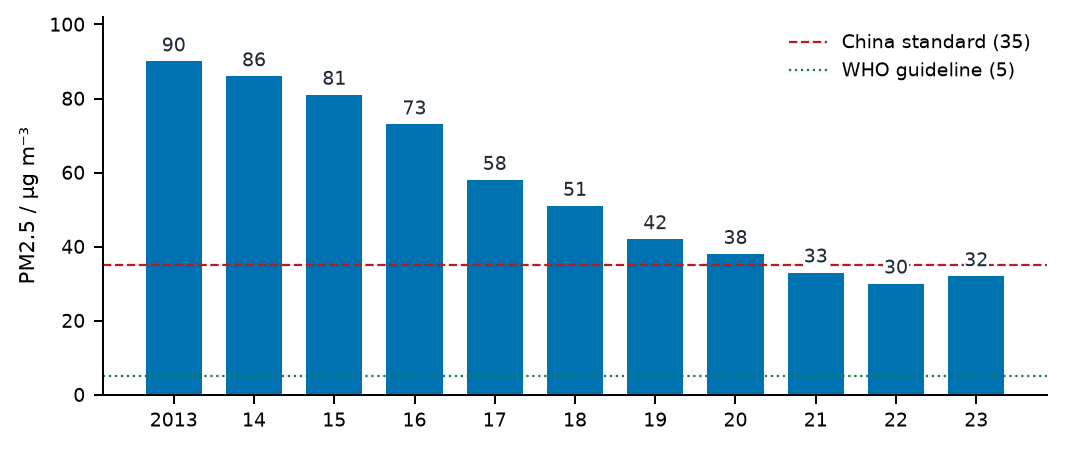
- Rounded annual PM2.5 fell from 90 in 2013 to 32 in 2023: reduction=(90−32)/90×100≈64.4%. Official 64.2% uses unrounded values.
- The 2023 mean is 32/5=6.4 times the WHO 2021 annual guideline. An annual average is different from a daily peak, and a guideline differs from a legal limit.
Evaluate a pollution intervention
- Cleaner heating, industry/vehicle controls and regional cooperation can contribute to improved city air. Weather and economic activity also affect concentrations.
- Compare costs, reliable heating, jobs, exposure distribution and displaced emissions. A before/after trend alone cannot isolate one measure’s causal effect.