Biodiversity, conservation and sampling evidence
引入| English | 释义 | 拼音 |
|---|---|---|
| evenness/ˈiːvənnəs/ | 均匀度 | jūn yún dù |
| species richness/ˈspiːsiːz ˈrɪtʃnəs/ | 物种丰富度 | wù zhǒng fēng fù dù |
What would explain this observation?
- A site with many individuals can still be dominated by one species. Abundance, richness and evenness 均匀度 describe different features of biodiversity.
Build the model
- Species richness 物种丰富度 counts species.
- Evenness concerns relative abundance.
- Conservation can protect habitats, populations or genetic diversity; a management judgement must state the conservation goal.
- species richness: The number of species recorded.
- evenness: How evenly individuals are distributed among species.

Two sites have three species each. Which can still differ?
难度 1/5 · 今日首次完成可获 100 金币及少量额外奖励
Richness counts species only; evenness describes how individuals are shared among them. Two sites can both have three species while one is dominated by a single species and the other is balanced - different evenness, same richness.
Match each technical term to its precise meaning.
难度 2/5 · 今日首次完成可获 140 金币及少量额外奖励
Use the definitions to distinguish related quantities and processes.
Choose evidence that can test it
- Compare surveys with similar area, effort, season and identification rules.
- A diversity index is meaningful only with its formula and conventions specified.
- Habitat fragmentation can affect movement and gene flow even when total area changes little.
In the lab: Use non-destructive field sampling approved by the school. Identify organisms with a suitable key and record uncertain identifications rather than inventing species. Combine ecological evidence with stakeholder perspectives on land use.
Which two habits make the investigation or model in this case more defensible?
难度 2/5 · 今日首次完成可获 140 金币及少量额外奖励
Stating the conditions and assumptions lets others repeat the work exactly, and recording the supporting evidence lets them check the conclusion. Hiding disagreeing results removes the evidence that could challenge a wrong conclusion, and one measurement can never establish a wider claim.
Work from known quantities
- Known: site A has counts 8, 1 and 1; site B has 4, 3 and 3.
- Both have richness 3 and total abundance 10.
- The most abundant species occupies 80% in A and 40% in B.
- B is more even under these counts.
Your turn: A survey records 6, 5, 3 and 2 individuals in four species. Find species richness.
丰富度相同,数量分布却不同
从A的8、1、1和B的4、3、3开始,两者都记录到3个物种和10个个体,但数量最多的物种分别占80%和40%。区分物种丰富度、总个体数和数量分布。
A survey records 6, 5, 3 and 2 individuals in four species. Find species richness.
难度 2/5 · 今日首次完成可获 140 金币及少量额外奖励
The result is 4 species. Known: counts 6, 5, 3 and 2 across four species. Species richness = number of species = 4. Total abundance = 16; evenness would need the distribution, which richness ignores.
Check the conclusion and its limits
- An index cannot by itself explain the cause of a difference.
- A newly recorded species may reflect improved observation rather than a recent ecological arrival.
Not true: A larger total number of individuals always means greater species richness. Richness counts how many species are present, not how many individuals. Ten thousand individuals of one species give richness 1, while ten species with one individual each give richness 10.
- Species richness counts species.
- Compare surveys with similar area, effort, season and identification rules.
- Watch for: an index cannot by itself explain the cause of a difference.
Richness counts how many species are present, not how many individuals.
难度 1/5 · 今日首次完成可获 100 金币及少量额外奖励
True. Richness counts how many species are present, not how many individuals. Ten thousand individuals of one species give richness 1, while ten species with one individual each give richness 10.
The number of species recorded: write the technical term.
难度 1/5 · 今日首次完成可获 100 金币及少量额外奖励
species richness means The number of species recorded.
Write from a richness of 5
- Counts are 9, 9, 9, 1 and 1 individuals, with one count per species.
- Find the species richness. The total number of individuals is a different quantity.
A survey records 9, 9, 9, 1 and 1 individuals in five species. What is the species richness, and why is it not 29?
Five species have nonzero counts, so richness = 5 species. Abundance = 9 + 9 + 9 + 1 + 1 = 29 individuals. Abundance counts individuals rather than species.
A survey records 9, 9, 9, 1 and 1 individuals, with one count per species. What is the species richness?
难度 1/5 · 今日首次完成可获 100 金币及少量额外奖励
Five species are listed, so the richness is 5. The 29 individuals are the abundance. Other options — 4 (the lesson richness for counts of 6, 5, 3 and 2); 29 (the total number of individuals).
Protect three kinds of variation
- Genetic biodiversity is inherited variation within a species. Species biodiversity concerns the species in a community and their relative abundances. Ecosystem biodiversity includes different communities and their physical environments. A crop field can have thousands of plants but few species and little genetic variation if the plants are one variety.
- Losing a genetically distinct population can reduce biodiversity before its species becomes globally extinct. Replacing a wetland with a plantation can lose an ecosystem even if the plantation contains many trees. State which level a conservation goal protects; one large count cannot measure all three.
Compare richness and dominance together
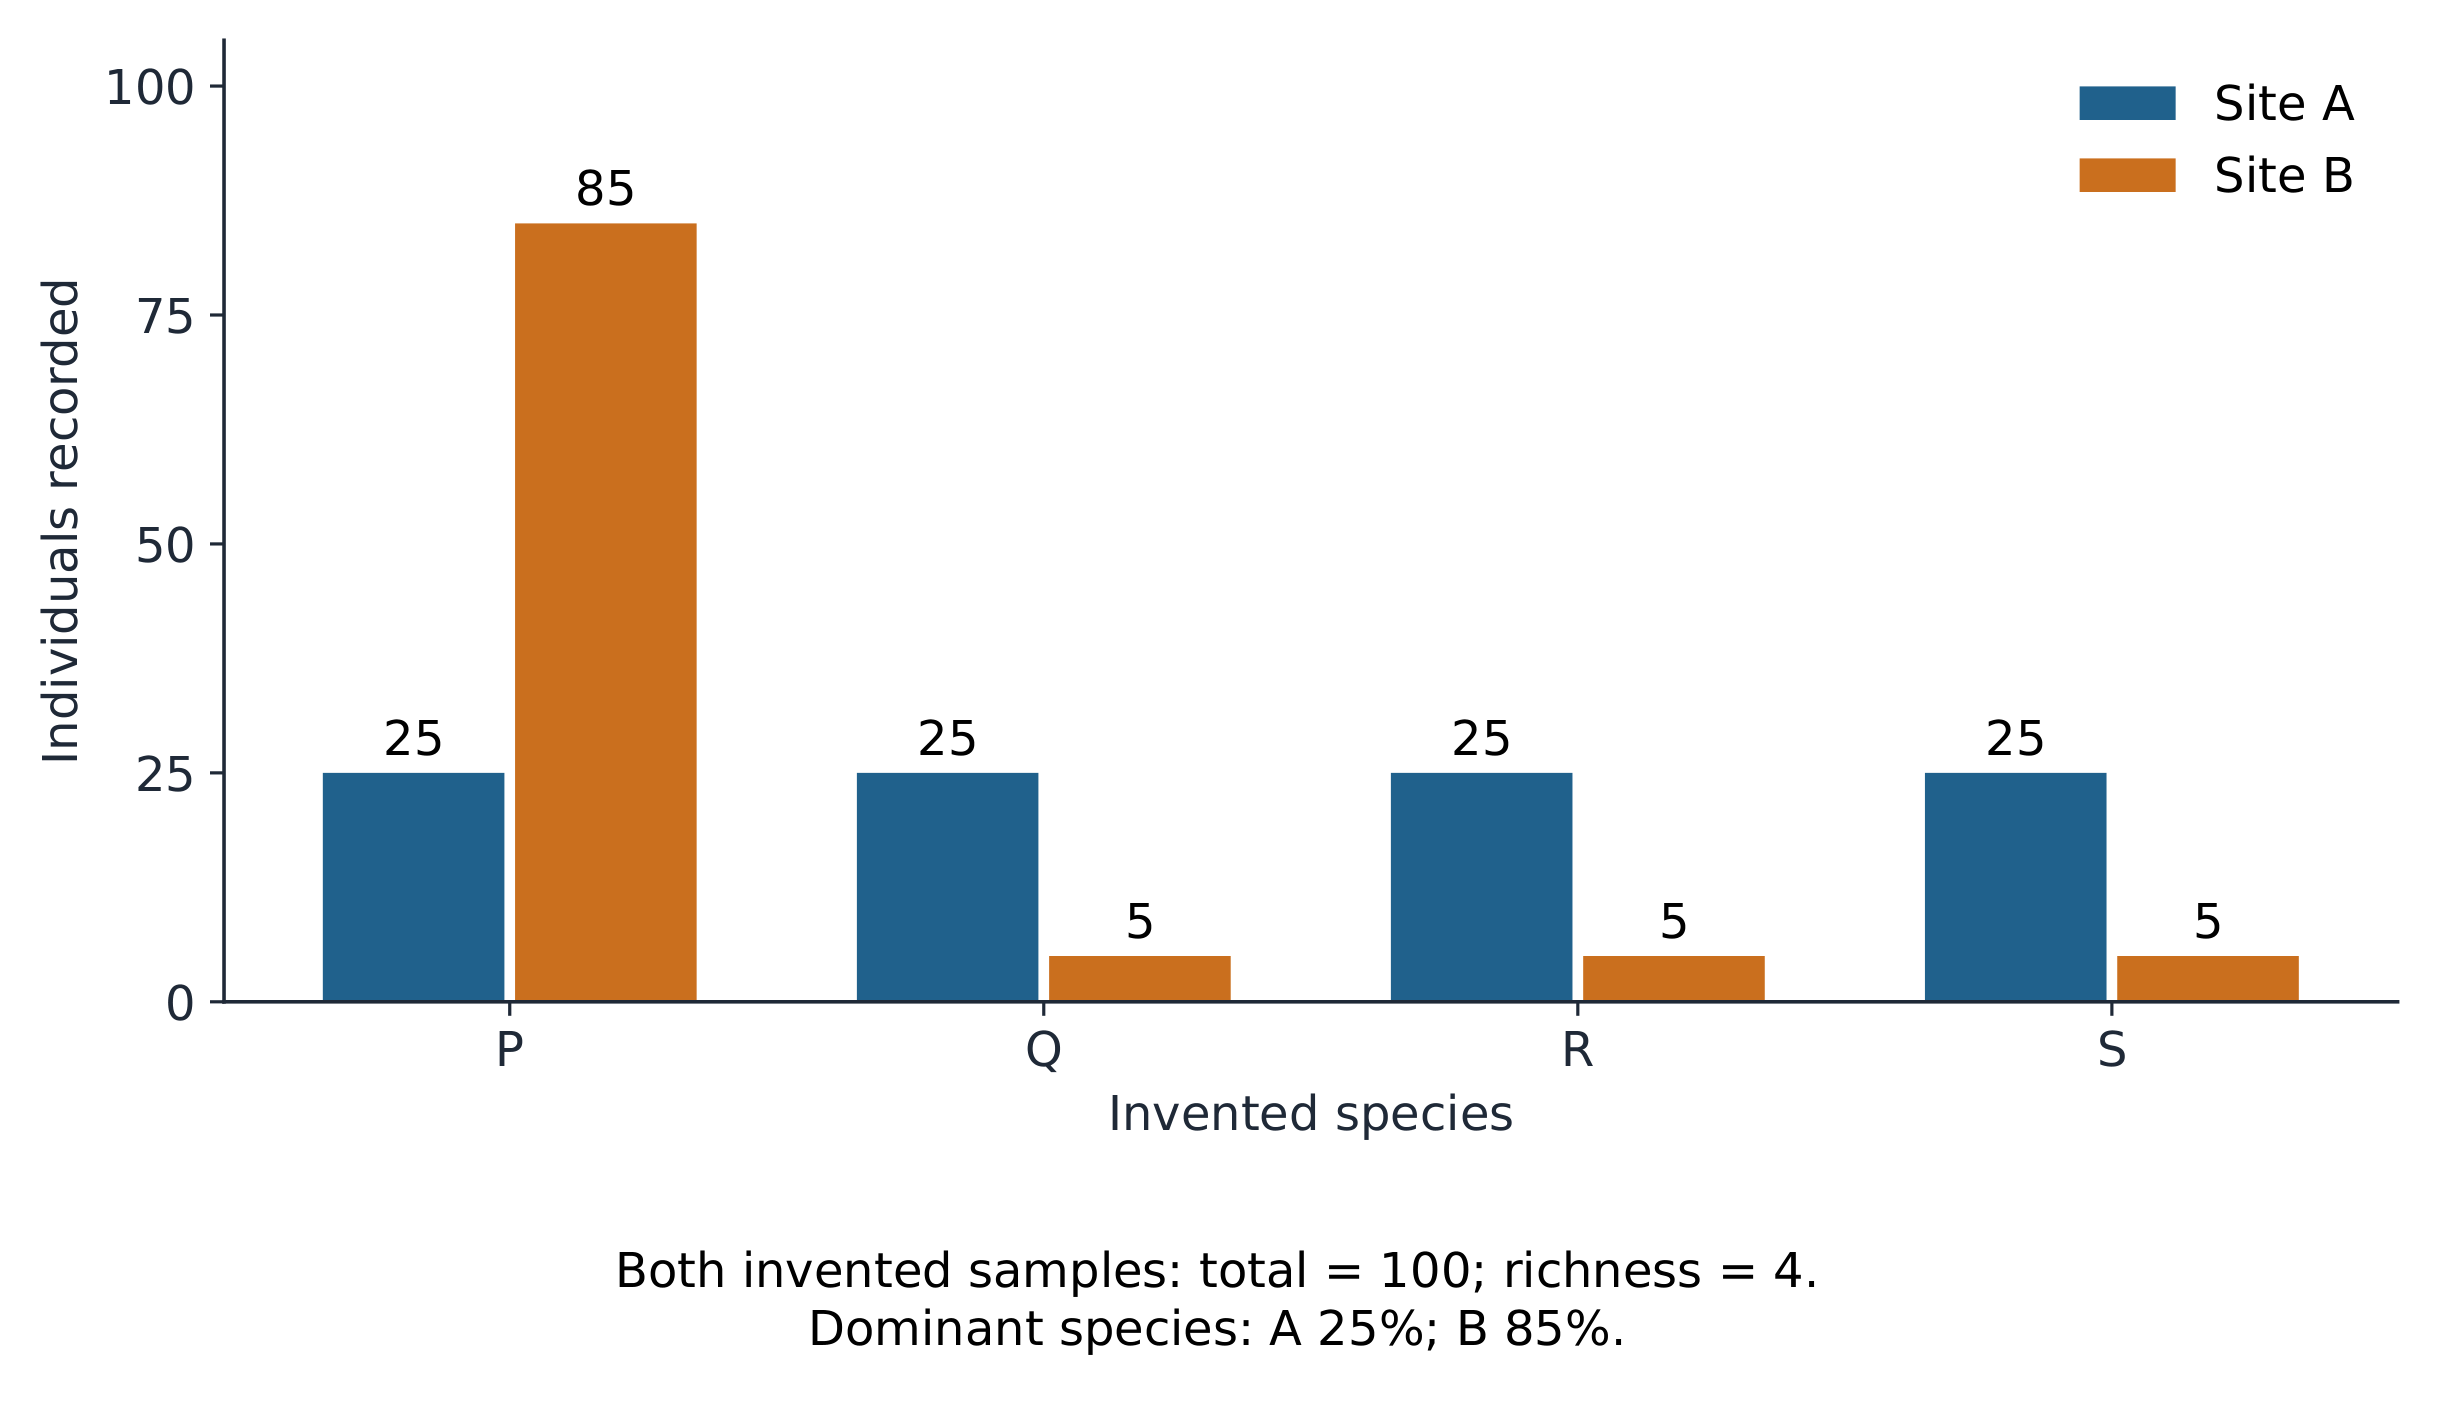
- In invented standardized surveys, A has counts 25, 25, 25, 25 and B has 85, 5, 5, 5. Both samples contain 100 individuals in four species. Their recorded richness is therefore 4, while the dominant species makes up 25% at A and 85% at B. A has greater evenness.
- The bars show these samples, not a complete census. A diversity index can summarize composition only when its formula and convention are specified. A high or low index does not identify the cause of a difference, nor does it reveal all the genetic variation within each species.
Distinguish extinction from a missing record
- Global extinction means a species has disappeared everywhere. Local disappearance is extirpation: it can still survive elsewhere. Extinct in the wild means individuals remain in captivity or cultivation. Not seeing a species during one survey is weaker evidence than well-designed repeated searches across its possible range.
- A last confirmed sighting, an estimated extinction date and an official assessment date answer different questions. A status review may occur long after the last individual died. Explain what the evidence establishes rather than assigning the review date as the observed death date.
Explain terrestrial and marine losses
- The North Island giant moa, Dinornis novaezealandiae, was a large flightless New Zealand bird. Its remains occur in archaeological sites, and human hunting for food was the main cause of extinction. Removing animals faster than reproduction replaces them can eliminate even a large-bodied species. See the Te Papa/Birds New Zealand account.
- The Caribbean monk seal, Neomonachus tropicalis, was heavily exploited, including for oil and meat. Its last confirmed sighting was in 1952. NOAA's account distinguishes this from the 2008 extinction declaration. A marine habitat did not protect it from human exploitation; 2008 is not a witnessed last-death date.
Connect river habitat to reproduction
- The Chinese paddlefish, Psephurus gladius, lived in the Yangtze system. Overfishing removed individuals, while dams fragmented river habitat and could obstruct access between feeding and spawning areas. Water remaining in a channel is insufficient if a population cannot complete its life cycle and replace losses.
- A 2020 study used historical records and surveys to infer extinction in the early twenty-first century. That is an evidence-based inference, not an observation of the final fish dying. Do not transfer its extinction status to every other Yangtze fish; species differ in biology, threats and evidence.
A seal was last confirmed in 1952 and declared extinct in 2008. Which conclusion uses these dates correctly?
难度 1/5 · 今日首次完成可获 100 金币及少量额外奖励
A last confirmed sighting differs from an inferred extinction and a later official assessment. Repeated searches, historical records and the range of possible surviving populations inform the extinction conclusion.
Track ecosystem loss rather than tree counts
- In Southeast Asian mixed dipterocarp forest, logging changes structure and roads can divide habitat. Later clearance for a plantation replaces much of the original community. Logged forest can still retain substantial biodiversity: degraded does not mean empty or worthless. Protect remaining forest as well as preventing further conversion.
- Yangtze estuary tidal flats provide feeding habitat and depend on water and sediment processes. Reclamation removes intertidal habitat; altered sediment supply can change deposition and erosion. The estuary study examines these changing areas. A protected boundary alone cannot maintain a wetland if the processes supporting it are disrupted.
An invented map shows suitable habitat falling from 1,000 ha to 760 ha. What percentage of the original area was lost?
难度 2/5 · 今日首次完成可获 140 金币及少量额外奖励
Loss = 1,000 − 760 = 240 ha. Relative loss = 240/1,000 × 100 = 24%. The remaining proportion is 76%. These area percentages do not establish corresponding percentages of species extinction.
Calculate area loss without inventing extinctions
- An invented map shows suitable wetland declining from 1,000 ha to 760 ha, using the same habitat definition. The loss is 240 ha. Relative to the original area, the percentage loss is $240/1000\times100=24\%$ and the remaining proportion is 76%.
- This does not mean 24% of species became extinct. Remaining habitat can be fragmented or degraded, some species can persist temporarily, and others may lose a critical breeding site. Combine area maps with repeated population surveys and measures of habitat quality before judging the biological effect.
Test whether connections really work
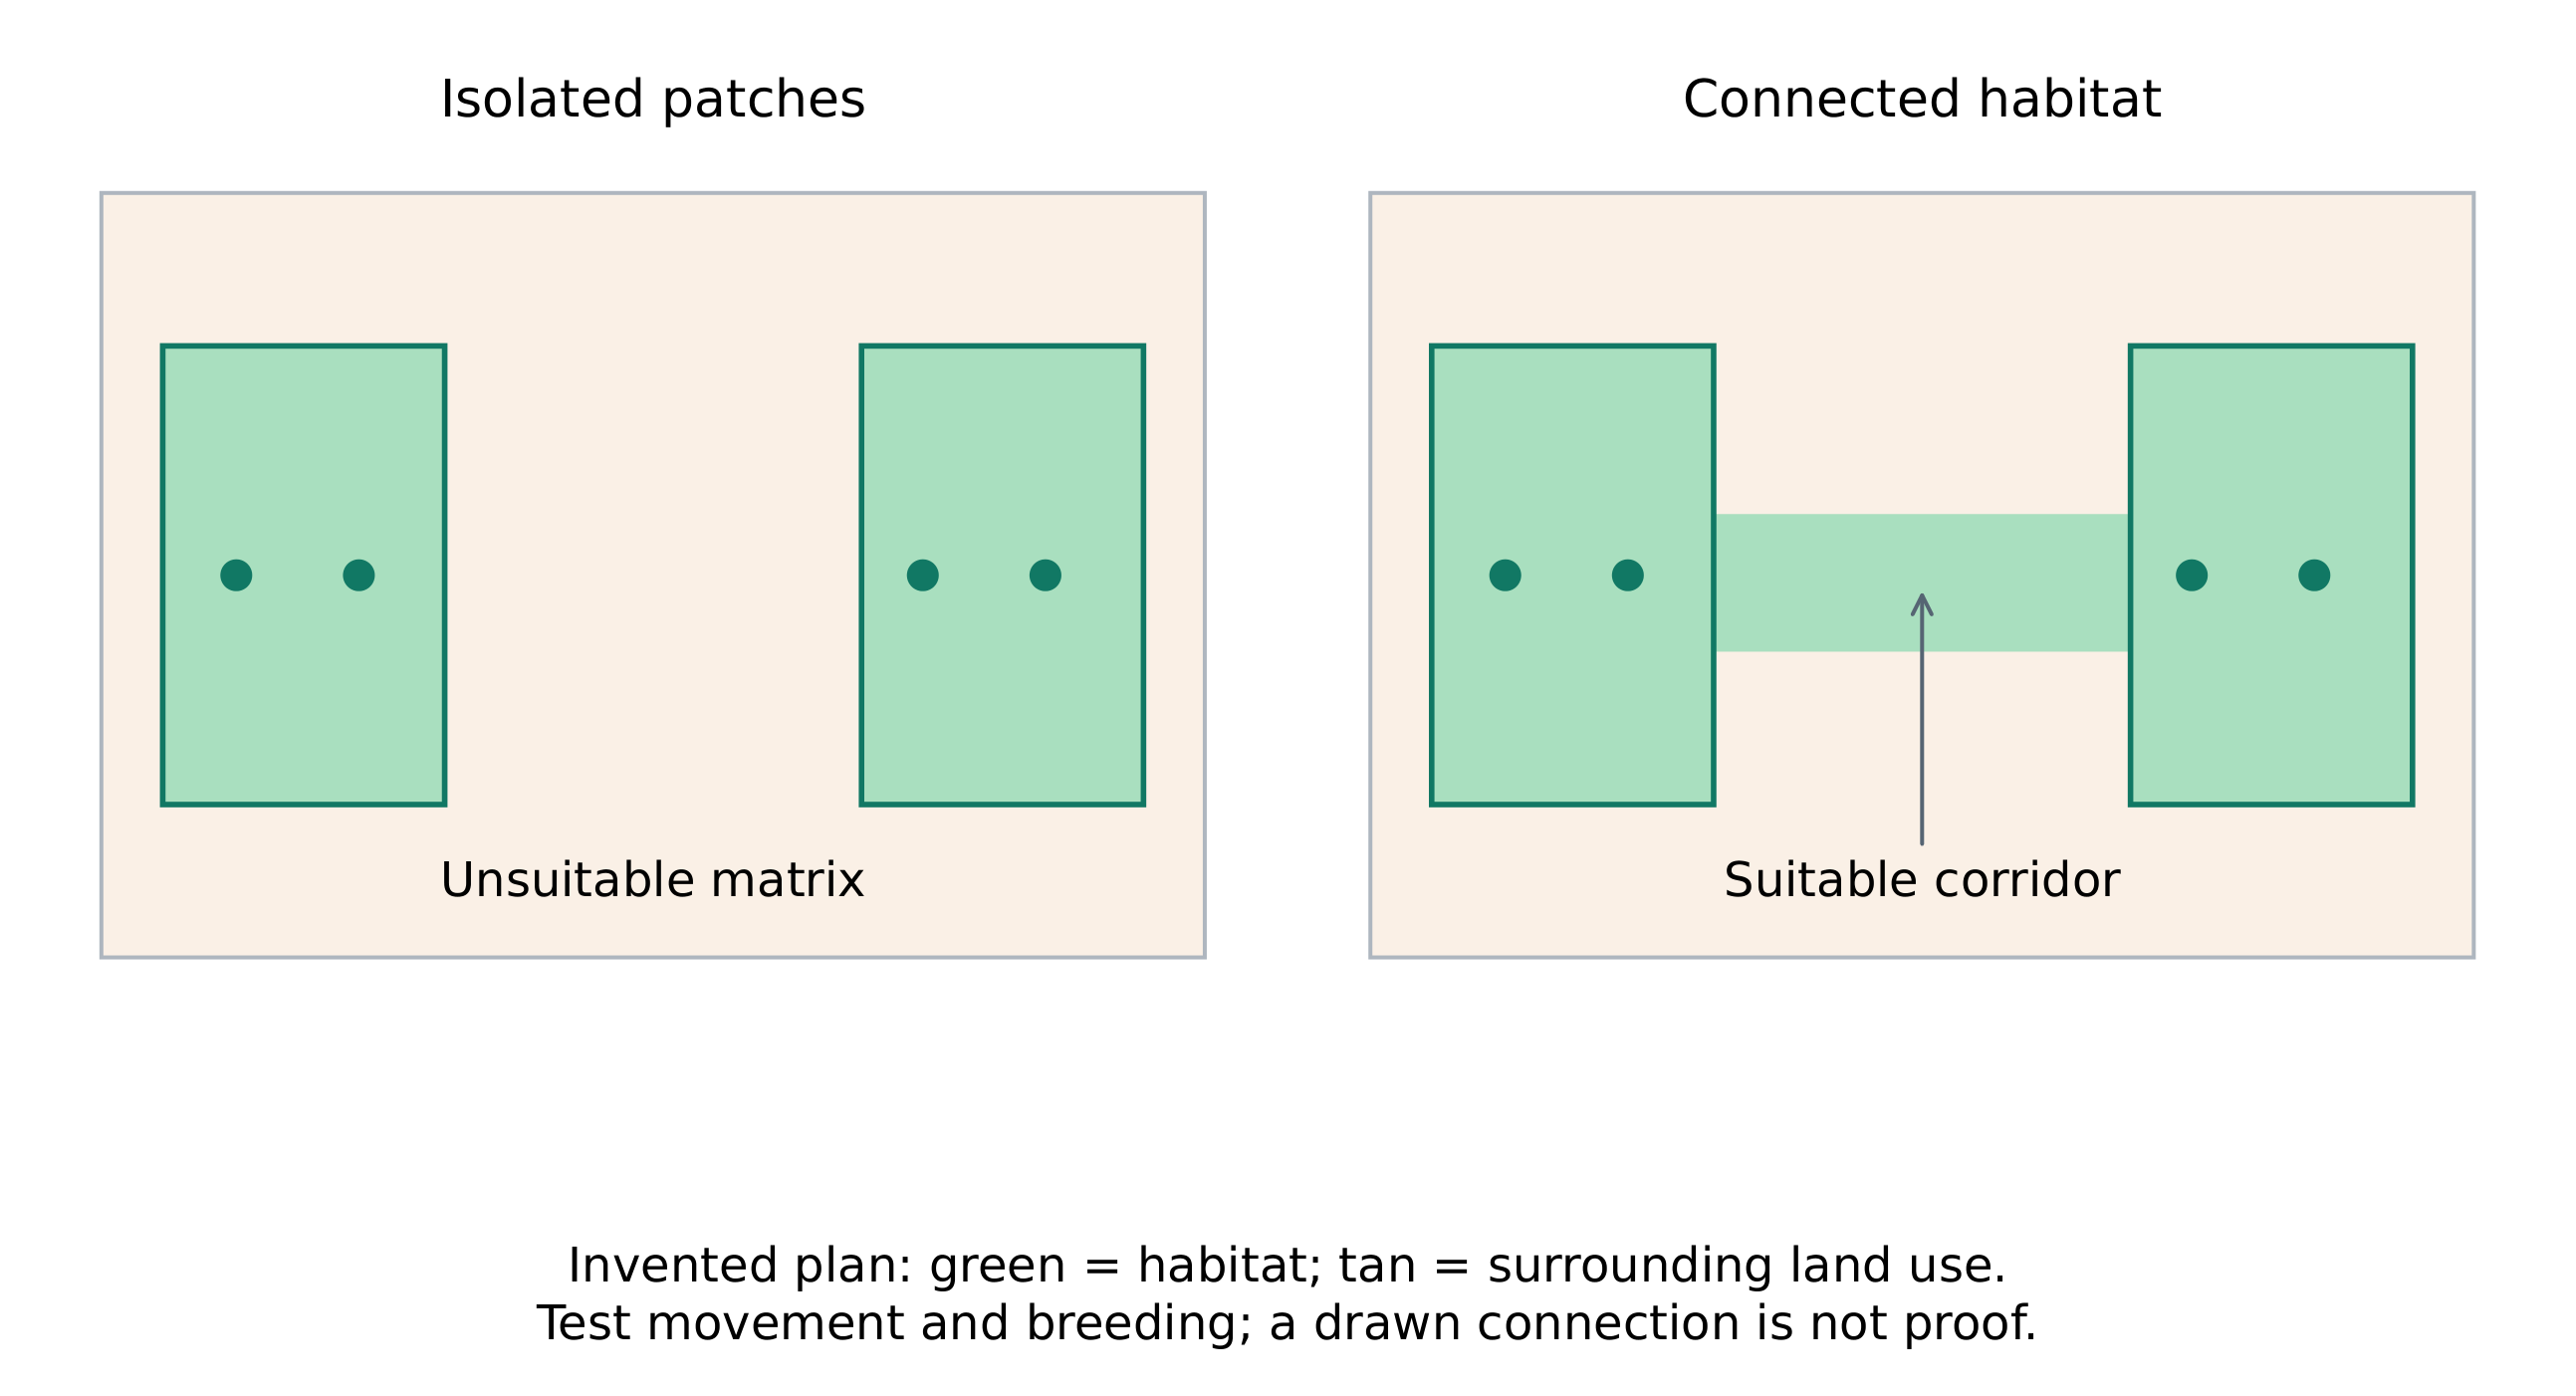
- Fragmentation divides a habitat into patches. Fewer movements between patches can limit mate finding, recolonization and gene flow. Small isolated populations can lose genetic variation or disappear by chance. Conditions at a newly exposed edge can also differ from conditions in the interior.
- A suitable corridor may reconnect patches, but its vegetation, width and road crossings must suit the target species. A strip can help one organism while failing another or spreading unwanted organisms. Test actual movement, survival and breeding rather than treating a line on a map as proof of restored gene flow.
In invented standardized samples of 100 individuals each, species P rises from 40 individuals to 65. By how many percentage points does its share increase?
难度 2/5 · 今日首次完成可获 140 金币及少量额外奖励
Its shares are 40% and 65%, so the increase is 25 percentage points. The relative increase in its share is 25/40 × 100 = 62.5%, a different quantity. Total sample abundance stays 100.
Read a change hidden by an unchanged total
- Invented counts for P, Q, R and S change from 40, 30, 20, 10 to 65, 25, 10, 0. Both samples total 100. Recorded richness falls from 4 to 3, and P's share rises from 40% to 65%: an increase of 25 percentage points, not a 25% relative increase.
- This pattern is consistent with a community becoming less even, despite unchanged total abundance. The missing S record suggests possible local loss, not global extinction. Compare the same area, effort, season, method and identification rules; use independent sampling units and report variation between them.
Compare time periods and evidence honestly
- Fossils show past diversification and major losses, but hard parts, accessible rocks and well-studied habitats are unevenly represented. More recorded species can reflect improved sampling or revised classification. High present richness and a present crisis can coexist: a large total can be declining rapidly.
- The IPBES 2019 assessment estimated around one million species threatened with extinction, not one million already extinct. Citizen surveys can extend coverage, but need training, consistent effort, photographs or expert verification and recorded uncertainty. A larger database is useful only when its biases are considered.
Turn a pressure list into causal explanations
- Over-exploitation removes organisms faster than replacement; habitat conversion removes resources and divides populations. Pollution can change survival and reproduction. Introduced organisms may become invasive or carry disease, though not every introduced species is harmful. Climate change can shift suitable conditions faster than some organisms can move or adapt.
- Human population growth can increase resource demand, but consumption, technology and management affect the resulting pressure. Link the named pressure to a mechanism for the species concerned. For example, a fragmented population may be unable to reach newly suitable habitat as its climate changes; the two pressures interact.
Keep habitat protection and restoration connected
- In situ conservation protects organisms in their natural habitats. A reserve needs management, enforcement and boundaries that include breeding, feeding and seasonal movement requirements. Protection on a map is a starting point; success means threats decline and populations can survive and reproduce.
- Restoration repairs degraded conditions, such as water flow and native vegetation. Rewilding seeks to restore ecological processes and, where appropriate, native organisms. Removing a cause of damage may matter more than planting many trees. Reintroduction needs suitable habitat and follow-up evidence of establishment and reproduction, not only a release count.
Use collections as a complement to living habitats
- Ex situ conservation keeps organisms outside their natural habitat, for example in managed breeding collections or botanic gardens. It can provide a safeguard during an immediate threat. Breeding must retain suitable genetic variation, health and behaviour; captive survival alone does not guarantee a self-sustaining wild population.
- Germplasm collections retain inherited material for reproduction. Many seeds tolerate drying and cold storage, but some do not and need other methods such as suitable tissue collections. Check identity, genetic representation and continuing viability. A stored seed cannot replace pollination, water flow or the whole ecosystem in which its species lives.
An invented wetland plant is threatened by drainage. Explain why a backup seed collection alone is insufficient and propose complementary action with evidence of success.
Match methods to the actual cause. Habitat protection, restoration, suitable backup collections and monitoring can address different parts of the problem.
Build a conservation plan around the cause
- An invented wetland plant is threatened by drainage. A defensible plan combines preventing further drainage, restoring suitable water conditions, protecting connected habitat and keeping a genetically representative backup collection using a method suitable for that species. Banking seeds while the last wetland is destroyed leaves the main cause unresolved.
- Set a baseline and measurable outcomes: suitable habitat area and quality, independent population counts, establishment, reproduction and genetic representation where feasible. Compare like-for-like surveys over time and involve affected people. More money spent or more organisms released is an input, not automatic evidence of recovery.
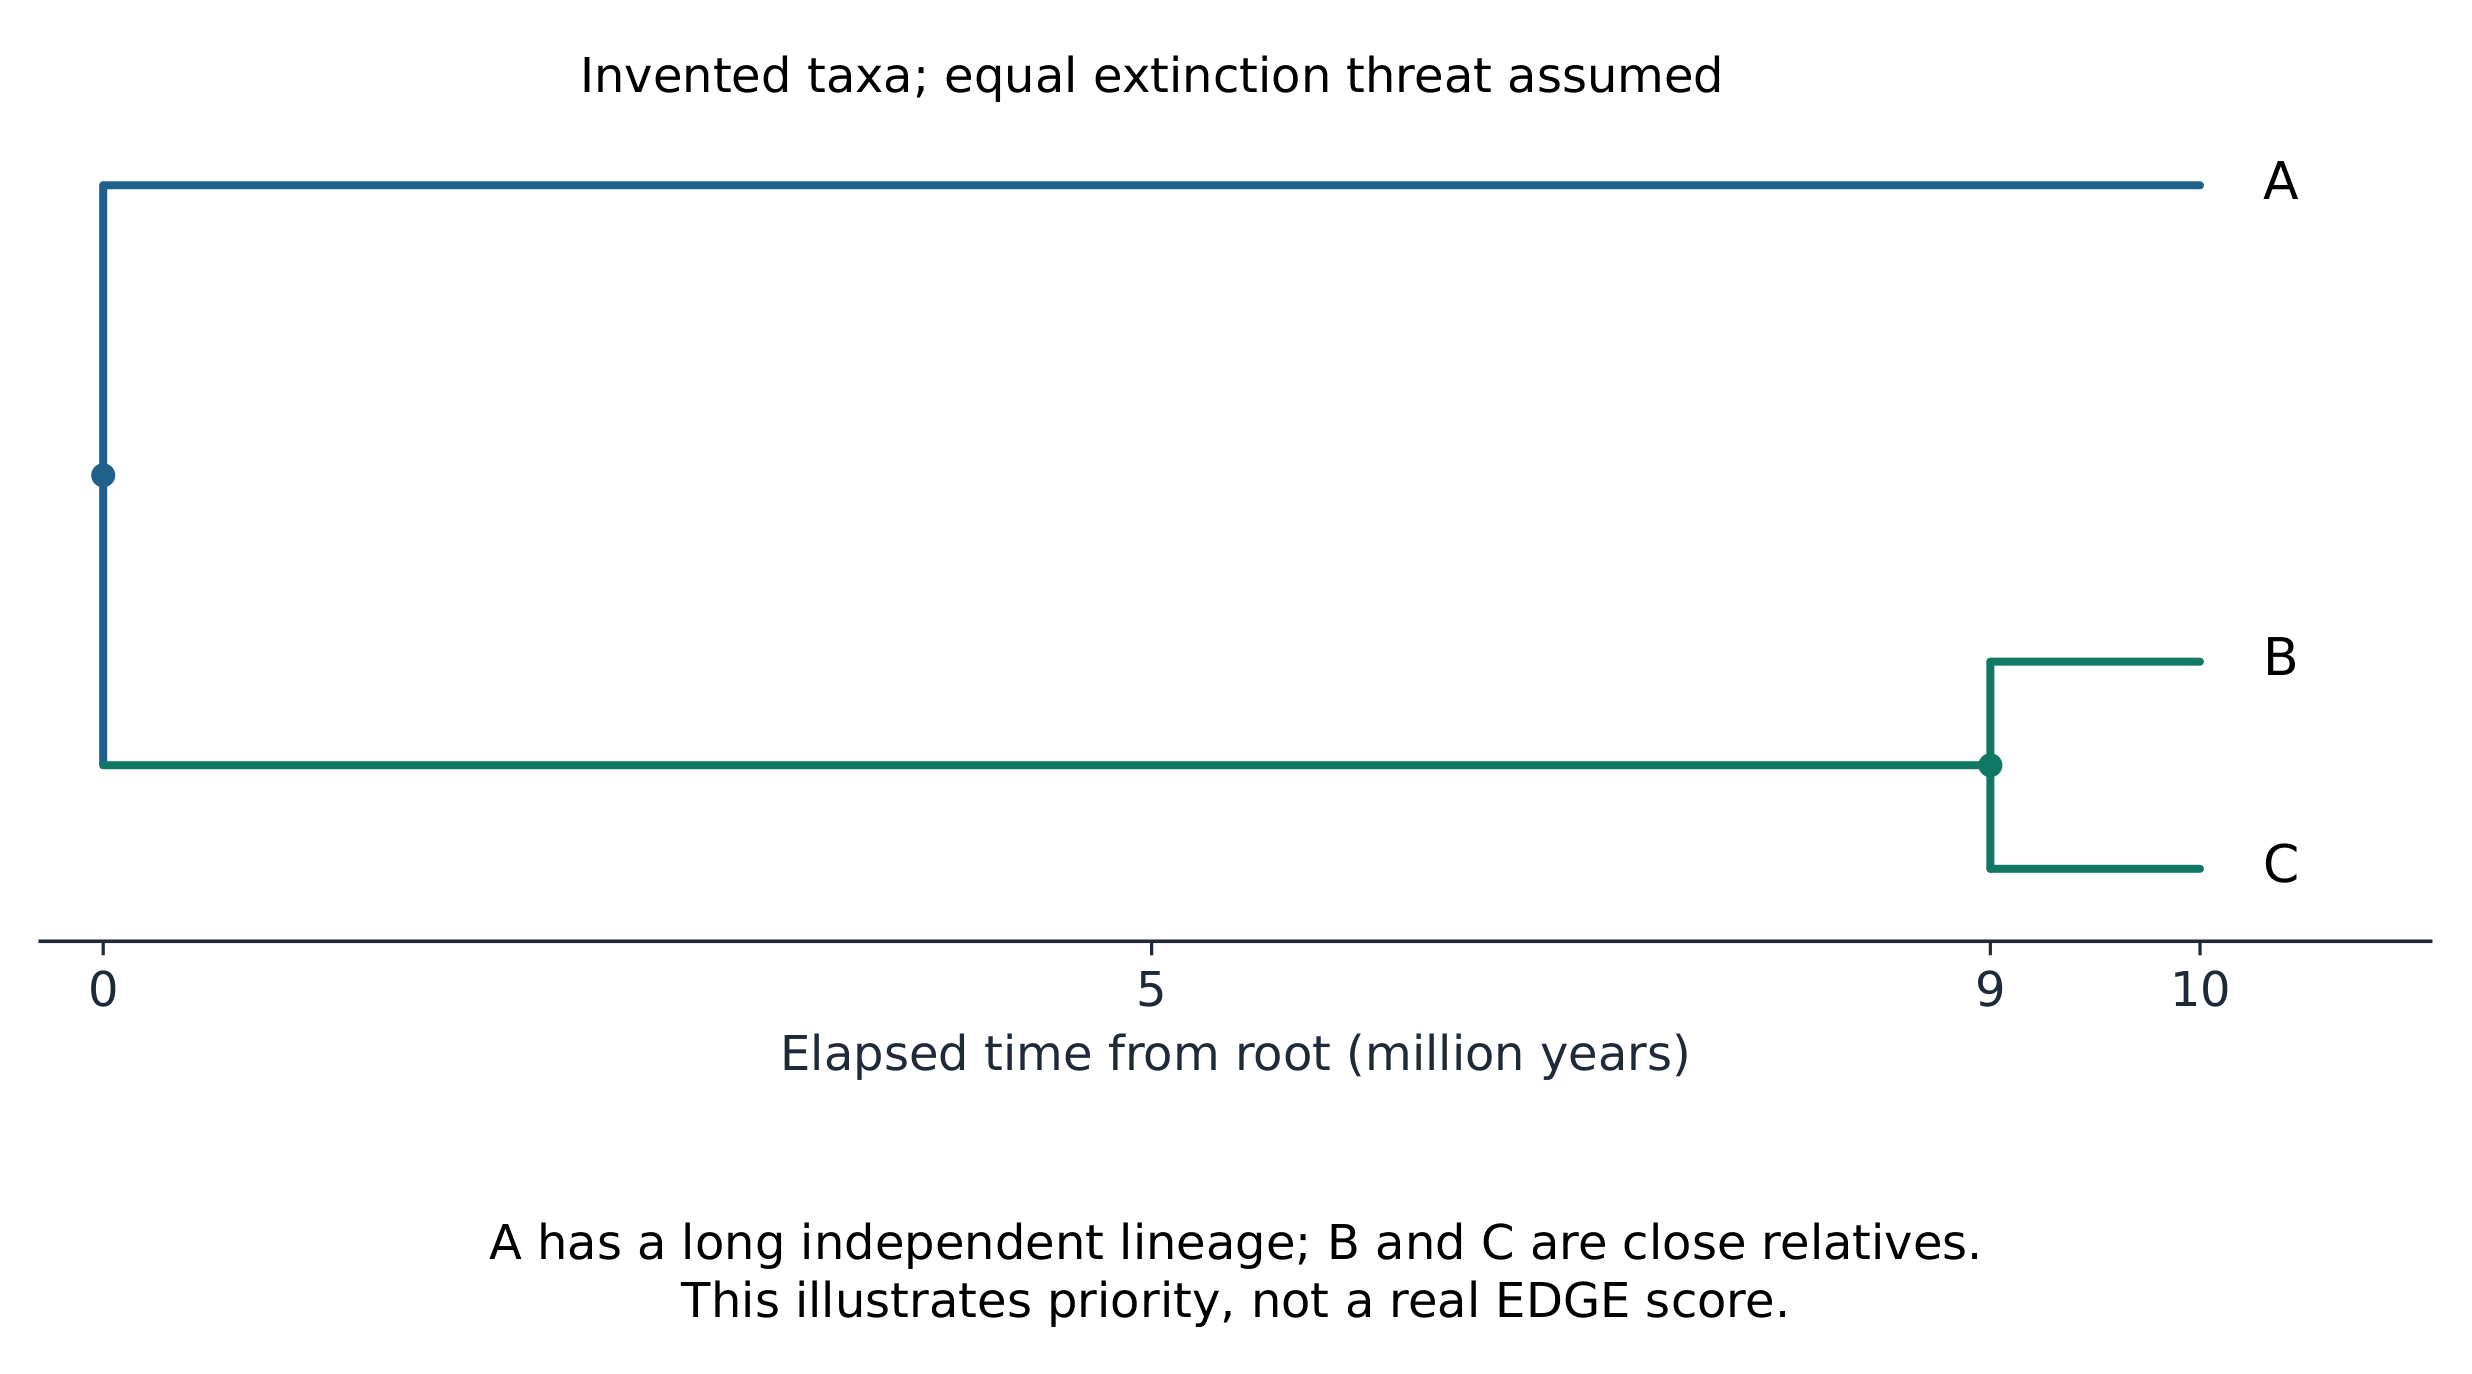
Invented A, B and C are equally threatened. A has a long independent branch on a dated tree; B and C share a recent ancestor. What is a defensible EDGE-based reason to prioritize A?
难度 1/5 · 今日首次完成可获 100 金币及少量额外奖励
Evolutionary Distinctiveness concerns represented history, and Global Endangerment concerns extinction risk. The simplified equal-threat case supports a qualitative rationale, not a fabricated numerical score or a population estimate.
Explain EDGE priorities and their limits
- EDGE combines Evolutionary Distinctiveness with Global Endangerment. Distinctiveness concerns relatively unique evolutionary history represented on a dated tree; endangerment concerns extinction risk. In this invented comparison, equally threatened A has a long independent branch while B and C share a recent ancestor. Saving A can protect more uniquely represented history.
- This is a qualitative rationale, not a real EDGE score. Use the programme's method for actual scoring. Priorities also depend on feasibility, cost, ecological roles and effects on people. State the conservation goal and trade-offs; neither an unusual appearance nor few observed individuals alone establishes evolutionary distinctiveness.
Read published trends from terrestrial and marine surveys
- Rigal et al. (2023) analysed 170 common bird species at more than 20,000 sites in 28 European countries. Over 1980–2016, the combined abundance indicator fell 25.4% and the farmland indicator fell 56.8%. Normalizing the latter to 100 initially gives $100(1-0.568)=43.2$ index units at the end. This is not a raw count of birds or a percentage of species extinct.
- The GCRMN 2020 report used monitoring from more than 12,000 reef sites in 73 countries. It estimated about 14% loss of live hard coral over 2009–2018 from coral-cover observations. The full monitoring dataset covers a longer period. Cover measures occupied seabed area, rather than the number of coral species.
Match the biodiversity claim to the measured indicator
- These published surveys provide evidence across terrestrial and marine habitats. Their intervals, methods and measured quantities differ: subtracting the decline percentages would not compare extinction rates. Inspect coverage and uncertainty rather than assuming every site or species followed the combined trend.
- Abundance and total coral cover do not alone establish changes in species richness or evenness. Record species identities and separate counts or cover repeatedly under comparable methods. A large fall in one indicator can occur without the same percentage of species disappearing.
A published farmland-bird abundance indicator declines 56.8%, while a reef report estimates about 14% loss of live hard coral over a different interval. Which conclusion is justified?
难度 1/5 · 今日首次完成可获 100 金币及少量额外奖励
The bird result concerns an abundance indicator; the reef result concerns coral cover. Different variables and intervals cannot be treated as interchangeable extinction rates. Richness and evenness require species-resolved observations.