Scope and prerequisites
Digital SAT framework; original paper practice is nonadaptive and gives no scaled-score prediction.
- Compare mean, median 中位数, range and standard deviation 标准差 qualitatively
- Predict the effect of adding or multiplying every data value
- Read frequency 频数 information without confusing values and counts
Prerequisites: Ordered data; frequency; mean and median.
Explain and choose the method
The mean uses the sum of all observations divided by their count; the median is the middle of the ordered observations. Frequency means a value repeats: if 2 occurs three times and 8 once, the mean is (3·2+8)/4=3.5, not (2+8)/2. The horizontal positions on a display are values and the frequencies determine how many observations they represent.
The range is maximum minus minimum; standard deviation describes typical distances from the mean. You need not memorise a full formula to compare simple equally centred distributions: data clustered close to the mean have smaller standard deviation than data moved further away symmetrically. An outlier can alter mean and spread substantially while leaving the median stable.
Adding c to every observation raises both mean and median by c but leaves range and standard deviation unchanged, because pairwise distances do not change. Multiplying every observation by a positive k multiplies mean, median, range and standard deviation by k. More generally spread scales by |k|, while a negative multiplier reverses ordering.
When comparing plots, inspect the scale and the number of observations before judging apparent width. A graph stretched horizontally can look more variable without representing different values. A claim about equality of standard deviations needs the actual distributions, not merely equal ranges or equal means.
A frequency counts repeated observations. Values 1, 3, 7 with frequencies 2, 1, 1 represent four observations: 1, 1, 3, 7. $\bar x=\sum fx/\sum f=(2(1)+1(3)+1(7))/4=3$. The median is $(1+3)/2=2$; it need not equal the mean.
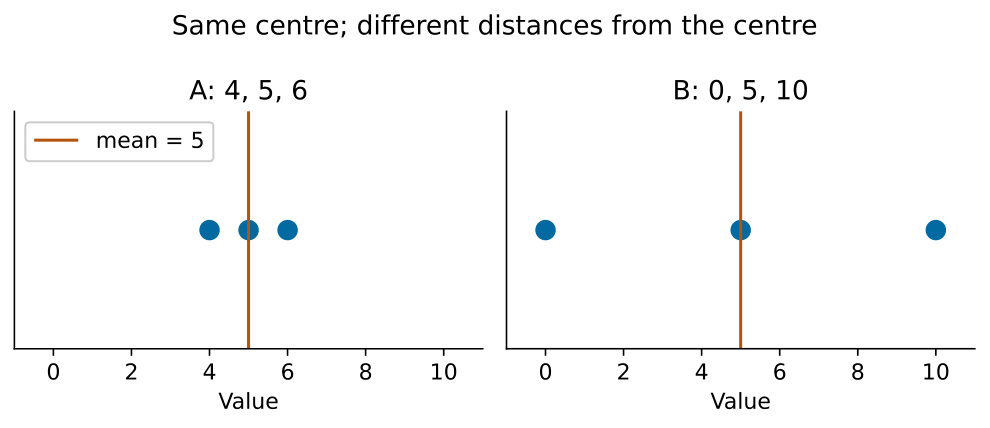
Existing worked example: A={4,5,6} and B={0,5,10} both have mean and median 5, but B has greater spread. Adding 7 gives A+7={11,12,13}, mean 12 and the same standard deviation as A. Multiplying A by 2 gives {8,10,12}; its mean is 10 and its range and standard deviation double. Equal range alone does not guarantee equal standard deviation.
Complete original context
Every transfer question states all data it needs.
Independent practice and checked reasoning
Transfer 1
Values 2, 5, 8 have frequencies 3, 2, 1. Find mean, median and range.
Reasoning: Data are 2,2,2,5,5,8. $\bar x=(3(2)+2(5)+1(8))/6=4$. Median is the average of positions 3 and 4, $(2+5)/2=3.5$. Range $R=8-2=6$.
Transfer 2
Every observation above is changed by $z=3x-4$. Find the new mean, median and range. State how standard deviation changes without computing it.
Reasoning: Mean $\bar z=3\bar x-4=3(4)-4=8$. Median is $3(3.5)-4=6.5$. Range is $3(6)=18$. Standard deviation triples; subtracting 4 changes no distance from the mean.
Transfer 3
Compare A = {0, 0, 10, 10} and B = {0, 5, 5, 10}. Both have range 10. Must their standard deviations agree? Justify.
Reasoning: Both means are 5. Every A observation is 5 from its mean; B distances are 5,0,0,5. B therefore has smaller mean squared deviation and smaller standard deviation. Equal range alone is insufficient.
Limits and next use
Do not average distinct category labels when frequencies differ, or confuse a shifted distribution with a more spread-out one.
All tasks here are public original practice with authored guidance. They are not official questions or fresh diagnostics. Existing protected tests and mocks remain separate.