Your learning plan · Continue · Review →
Task 1 — select, report, and write the overview
แนะนำใหม่ตำแหน่งที่บันทึกของคุณจะคงอยู่ในเบราว์เซอร์นี้ การต่อจากตำแหน่งไม่ได้ทำให้บทเรียนเสร็จสิ้นหรือตอบคำถาม
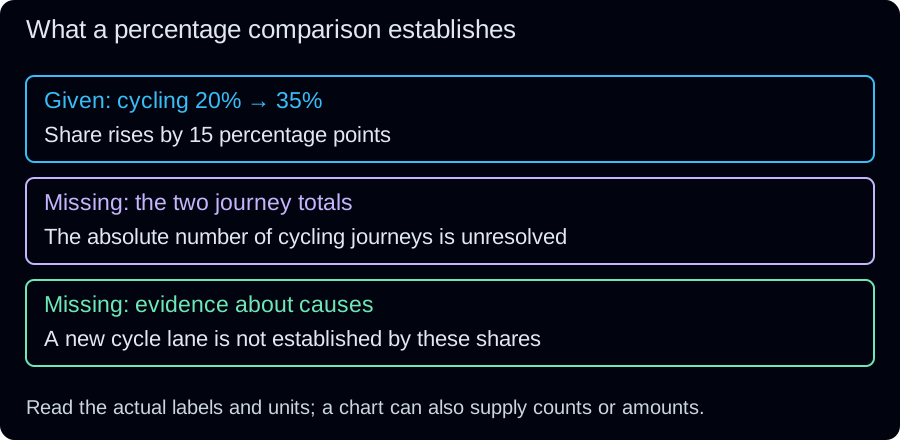
A rising share does not tell you the number of journeys
- Outcome: select the main features, group accurate comparisons and draft/revise a connected report. Start with Academic Writing orientation and the writing criteria. Original survey: cycling is 20% in 2020 and 35% in 2025; cars are 50% and 40%; other travel is 30% and 25%. Cycling gains share while the others fall, and cars remain the largest category.
- The totals are not supplied. You cannot conclude that the number of cycling journeys rose or that a new cycle lane caused the change. A percentage knows its share of the pie, but not how big the whole pie was.

In Task 1 you should explain why the trend happened.
Difficulty 1/5 · 100 coins + a small bonus on first completion today
Report what the visual information supports. An invented cause is unsupported and takes space from the task; no single sentence establishes an automatic score cap.
An overview selects the main picture
- In this survey, “Cycling gained share while the other categories declined; cars remained the largest category” summarises the main patterns. “Cycling was 20% in 2020” is one supporting detail rather than the overall comparison.
- Main features depend on the visual: a dominant category, major change, important crossover or stable feature can matter. Do not force a crossover into a chart without one. An overview need not use a prescribed number of sentences.
In a visual with an important overall movement and a major line crossover, which features could be selected for the overview? Choose all that apply.
Difficulty 2/5 · 140 coins + a small bonus on first completion today
An overview selects the main patterns, such as the largest category or a major change. Supporting figures belong mainly in the detail paragraphs; avoid invented causes or opinions.
Group details around meaningful comparisons
- Introduce what the visual shows, give the main picture, then develop useful groups of details. For this survey, compare the rising cycle share with the falling shares; support each comparison with given values.
- One usable structure puts the overview after the introduction and develops two detail groups. It is not a mandatory paragraph recipe. A different visual may need another organisation; listing every value in display order can hide the relationships.
Put this suggested Task 1 plan in a useful order.
Difficulty 3/5 · 200 coins + a small bonus on first completion today
This plan introduces the visual, summarises its main picture and develops grouped details. It is one usable structure, not a mandatory paragraph or overview placement rule.
Read labels and totals before claiming an amount
- A percentage-only housing comparison of 26% and 38% of income supports a larger share, but not necessarily a larger amount spent. If total income also changed, the amount depends on both share and total.
- A pie chart can label counts, amounts or percentages. Read its labels and units rather than assuming its shape supplies only shares. When amounts are given, use them; when only percentages are given, keep the claim at that level.
A percentage-only housing comparison rises from 26% to 38% of income; total incomes are not given. Which sentence is supported?
Difficulty 1/5 · 100 coins + a small bonus on first completion today
The given percentages establish a larger share. Amount spent also depends on total income. A pie chart may show other units, so read its actual labels rather than generalising from its shape.
A diagram explicitly labels 120 bottles before sorting. What supports reporting that quantity?
Difficulty 1/5 · 100 coins + a small bonus on first completion today
The diagram supplies the count. Process information can include quantities, temperatures and durations.
Process and map descriptions follow their actual labels
- A process may supply temperatures, durations or quantities as well as stages. For an original label “Heat water to 80°C, then filter it”, include the relevant temperature and sequence. Use passive forms when the actor is unimportant, and active forms when a named actor matters.
- Maps can compare past, present or proposed layouts. Choose tenses from their dates and status: “In the proposed plan, the entrance will move east” does not claim it has moved already. Describe what is shown without inventing features or changes.
Rewrite in the passive: 'People collect the bottles.' → 'The bottles ___ collected.'
Difficulty 1/5 · 100 coins + a small bonus on first completion today
Are collected is the present passive form. It fits when the collection stage matters more than the actor; other process descriptions may appropriately use active verbs.
A map labels an eastern entrance as a proposed future change. Which description preserves that status?
Difficulty 1/5 · 100 coins + a small bonus on first completion today
The proposal is a future layout. Do not claim that it has already been built.
Check detail against the same evidence
- Cycling rises by 15 percentage points to 35%; cars fall by 10 points to 40%. These details support the overview and preserve the supplied units. A share increase alone leaves the absolute journey count unresolved.
- Format checked on 19 October 2026: official IELTS Academic Writing guide. Our survey, process and map snippets are original teaching examples; the short checks do not predict a band.

View the original survey case at full size
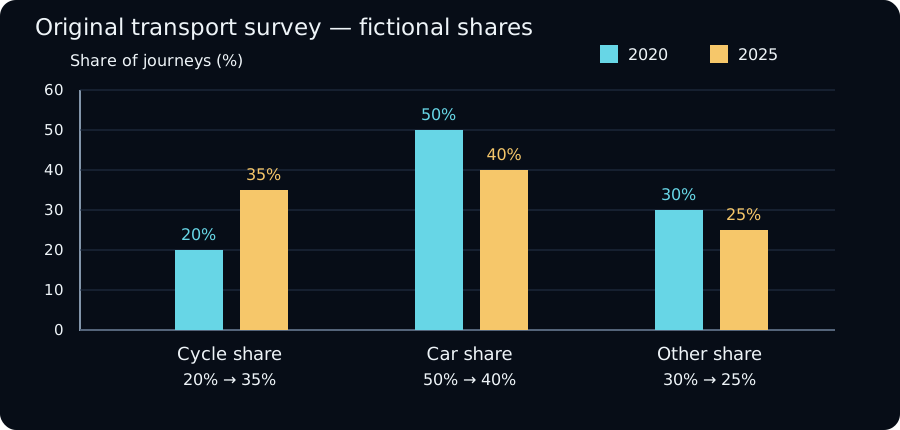
- Select the main picture, support it with accurate details and keep every claim within the supplied evidence.
Match the distinctions in this worked case.
Difficulty 2/5 · 140 coins + a small bonus on first completion today
Detail: cycling rose by 15 percentage points to 35%, while cars fell by 10 points to 40%. Both descriptions select comparisons from the same values without inventing a cause.
Which category has the largest share in 2025?
Difficulty 1/5 · 100 coins + a small bonus on first completion today
Original data: cycle share is 20% in 2020 and 35% in 2025; car share is 50% and 40%; other travel is 30% and 25%. Overview: cycling rose while the other two shares fell; cars remained the largest category. Detail: cycling rose by 15 percentage points to 35%, while cars fell by 10 points to 40%. Both descriptions select comparisons from the same values without inventing a cause.
Cycling shares of 20% and 35%, with neither total supplied, prove that the number of cycling journeys rose.
Difficulty 1/5 · 100 coins + a small bonus on first completion today
Counts require totals as well as shares. Different totals could produce an unchanged or lower number despite a higher share.
Different measures can produce different leaders
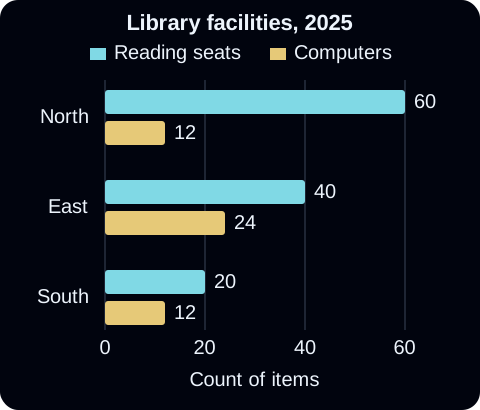
- Worked static comparison: the original chart below gives reading seats and computers at three libraries in 2025. A weak overview, “North had the most facilities in every category”, misreads the computer bars. A more accurate excerpt is “North had the most reading seats, whereas East had the most computers; South had the fewest seats.” Support it with 60 seats at North and 24 computers at East. South and North each had 12 computers. This is one year, so increased would invent a trend.
- Worked mixed-data comparison: a fictional museum had 80 thousand visits and £320 thousand total income in 2019, then 120 thousand visits and £360 thousand income in 2024. “Both rose by the same amount” hides unlike units and bases. A better overview excerpt is “Both measures increased, but visits grew proportionally more.” Visits rose 50%; income rose 12.5%. Income per visit fell from £4 to £3, but that calculated average is not a stated ticket price. Neither excerpt is a complete 150-word report. A confident adjective cannot rescue the wrong denominator; it only makes the error stand taller.

Guided decisions: evidence first, wording second
- Ten original data displays each offer a planning cue. Identify the measure, unit, dates and any projection before deciding what belongs in the overview. Compare endpoints and intermediate observations separately: equal endpoints do not mean the whole period was unchanged.
- These are short decisions about writing. They practise selection, grouping and evidence boundaries; they are not ten complete reports or official multiple-choice Writing tasks. Read the explanation after each attempt and repair the specific issue: a wrong column, an invented cause, a denominator or an unsupported time claim.
Original teaching data — river ferry passengers:
| Year | Passengers (thousands) |
|---|---|
| 2018 | 40 |
| 2020 | 55 |
| 2022 | 48 |
| 2024 | 70 |
Decision: Which overview preserves the sampled pattern?
Choose ONE answer.
Planning cue: Compare endpoints, then check the intervening values.
Difficulty 1/5 · 100 coins + a small bonus on first completion today
The endpoints rise from 40 to 70, but 55 falls to 48 before the final rise. Doubling would require 80. No ticket-price evidence is given. An overview can include the broad movement and its important interruption.
Original teaching data — three sports centres in 2024:
| Centre | Visits (thousands) |
|---|---|
| Elm | 90 |
| Pine | 60 |
| Oak | 30 |
Decision: Which is a suitable main comparison?
Choose ONE answer.
Planning cue: A single-date comparison gives rank, not a trend.
Difficulty 1/5 · 100 coins + a small bonus on first completion today
Elm leads 90 to 60 to 30, and 90 is three times 30. One year does not show change or growth speed. Pine is two thirds of Elm, while Oak is one third.
Original teaching data — household energy shares:
| แหล่งที่มา | 2015 (%) | 2025 (%) |
|---|---|---|
| แก๊ส | 60 | 45 |
| ไฟฟ้า | 30 | 40 |
| Other | 10 | 15 |
Decision: Which change statement is accurate?
Choose ONE answer.
Planning cue: Keep by, to and the unit separate.
Difficulty 1/5 · 100 coins + a small bonus on first completion today
60 minus 45 is 15 percentage points; the endpoint is 45%. Counts or energy units are not supplied. A relative fall is 15/60 = 25%, not 15%.
Original teaching data — book club participation:
| Year | Members | Share attending weekly (%) |
|---|---|---|
| 2020 | 200 | 40 |
| 2025 | 100 | 60 |
Decision: What can be said about weekly attendees?
Choose ONE answer.
Planning cue: Multiply each share by its own year’s total.
Difficulty 1/5 · 100 coins + a small bonus on first completion today
40% of 200 is 80; 60% of 100 is 60. The share rises by 20 points while the count falls. Given totals allow this calculation; do not keep a count unknowable when the necessary data are present.
Original teaching data — library facilities in 2025:
| Library | Reading seats | Computers |
|---|---|---|
| North | 60 | 12 |
| East | 40 | 24 |
| South | 20 | 12 |
Decision: Which overview covers both measures?
Choose ONE answer.
Planning cue: A leader in one column need not lead the other.
Difficulty 1/5 · 100 coins + a small bonus on first completion today
North leads seats at 60; East leads computers at 24. Building size is not measured, and South differs from East in both counts. Keep each ranking attached to its measure.
Original teaching data — museum visits and income:
| Year | Visits (thousands) | Total income (£ thousands) |
|---|---|---|
| 2019 | 80 | 320 |
| 2024 | 120 | 360 |
Decision: Which main comparison is supported?
Choose ONE answer.
Planning cue: Compare relative change within each measure; do not compare unlike raw differences.
Difficulty 1/5 · 100 coins + a small bonus on first completion today
Visits rise 40/80 = 50%; income rises 40/320 = 12.5%. The equal numerical differences have different units and bases. Income per visit would fall from £4 to £3, but total income does not identify the ticket price.
Original teaching data — studio membership:
| Year | Members |
|---|---|
| 2010 | 80 |
| 2015 | 120 |
| 2020 | 100 |
Decision: Which sentence avoids inventing observations?
Choose ONE answer.
Planning cue: Limit a peak claim to the period and observations supplied.
Difficulty 1/5 · 100 coins + a small bonus on first completion today
120 is the largest displayed value; 100 remains above 80. Unrecorded years and earlier history are unknown. There is a rise then a fall across the shown intervals, not a continuous decline.
Original teaching data — commuting categories:
| Mode | 2020 (%) | 2025 (%) |
|---|---|---|
| บัส (Bus) | 40 | 30 |
| Rail | 20 | 30 |
| Walk | 25 | 25 |
| Other | 15 | 15 |
Decision: Which grouping gives a useful report plan?
Choose ONE answer.
Planning cue: Group meaningful relationships, while retaining important stable features.
Difficulty 1/5 · 100 coins + a small bonus on first completion today
Bus falls and rail rises, meeting at 30%; walk and other stay constant. These groups retain the key patterns. Bus plus rail is 60% in both years, but the data do not attribute change to a policy. Bus and rail move in opposite directions, so grouping them as both increasing is inaccurate.
Original teaching data — water consumption estimates:
| Year | Observed litres per household per day | Projected litres per household per day |
|---|---|---|
| 2020 | 180 | — |
| 2025 | 160 | — |
| 2030 | — | 140 |
Decision: Which description preserves status?
Choose ONE answer.
Planning cue: Read the observed/projected labels before choosing the tense.
Difficulty 1/5 · 100 coins + a small bonus on first completion today
160 is the observed 2025 value; 140 is a projection for a household average in 2030. A projection is not an observed result or an exact guarantee for every household.
Original teaching data — two independent visitor surveys:
| สถานที่ | Visitors asked | Share preferring evening entry (%) |
|---|---|---|
| Gallery | 100 | 60 |
| Garden | 200 | 40 |
Decision: Which comparison is accurate?
Choose ONE answer.
Planning cue: Calculate counts before comparing unequal sample sizes.
Difficulty 1/5 · 100 coins + a small bonus on first completion today
Gallery: 60 of 100; garden: 80 of 200. The first share is higher, but its count is smaller. The combined share is 140/300, not 60+40%. Different survey bases cannot be added as one percentage.
Independent decisions across twenty fresh data displays
- The next twenty sources remove the planning cue. Some compare places at one date; others compare sampled times, proportions, rates or mixed measures. Preserve what is actually measured. Visits can include repeated visits; an index is not a count, and current-price sales do not establish inflation-adjusted growth.
- Select the best answer to the current question, then explain why the alternatives distort the evidence or fail its reporting purpose. These twenty decisions do not establish independent report-writing ability or an IELTS band. Break the unit across sessions and keep a short list of the mistakes you need to repair.
Original teaching data — harbour bus journeys:
| Year | Journeys (millions) |
|---|---|
| 2016 | 12 |
| 2019 | 18 |
| 2022 | 15 |
| 2025 | 21 |
Decision: Which overview fits all four observations?
Choose ONE answer.
Difficulty 1/5 · 100 coins + a small bonus on first completion today
21 exceeds 12, while 18 falls to 15 before the final increase. Doubling 12 would give 24, and the final level is above the start. Check the intermediate points before using uninterrupted.
Original teaching data — three galleries in 2023:
| Gallery | Exhibitions |
|---|---|
| Cedar | 12 |
| Birch | 8 |
| Willow | 4 |
Decision: Which is a supported comparison?
Choose ONE answer.
Difficulty 1/5 · 100 coins + a small bonus on first completion today
12 is three times 4. The single year provides a cross-gallery ratio, not a within-gallery change or prior-year loss. Birch has two thirds of Cedar’s count, not twice as many.
Original teaching data — household spending shares:
| Category | 2014 (%) | 2024 (%) |
|---|---|---|
| Housing | 25 | 40 |
| Food | 35 | 25 |
| Other | 40 | 35 |
Decision: Which sentence uses the correct change unit?
Choose ONE answer.
Difficulty 1/5 · 100 coins + a small bonus on first completion today
40 minus 25 is 15 percentage points. The relative increase is 15/25 = 60%; money totals are absent. The new share is 40%, not 15%.
Original teaching data — club registration and attendance:
| Year | Registrations | Weekly-attendance share (%) |
|---|---|---|
| 2019 | 300 | 20 |
| 2024 | 200 | 40 |
Decision: Which conclusion follows?
Choose ONE answer.
Difficulty 1/5 · 100 coins + a small bonus on first completion today
300×20% = 60 and 200×40% = 80. The share rises by 20 percentage points, equivalent to a doubling of that share. Both denominators are given, so calculate before deciding the count trend.
Original teaching data — three learning centres in 2025:
| Centre | Study seats | Tablets |
|---|---|---|
| West | 90 | 15 |
| Central | 60 | 30 |
| River | 30 | 15 |
Decision: Which overview retains the main rankings?
Choose ONE answer.
Difficulty 1/5 · 100 coins + a small bonus on first completion today
90 is the largest seat count, while 30 is the largest tablet count. River and West both have 15 tablets. Building area is not supplied. Avoid replacing two specific rankings with an unsupported overall size claim.
Original teaching data — theatre audiences and receipts:
| Year | Attendances (thousands) | Total receipts (£ thousands) |
|---|---|---|
| 2018 | 50 | 250 |
| 2024 | 75 | 300 |
Decision: Which summary compares growth correctly?
Choose ONE answer.
Difficulty 1/5 · 100 coins + a small bonus on first completion today
25/50 = 50%; 50/250 = 20%. Receipts per attendance fall from £5 to £4, but receipts are not labelled ticket-only income, so ticket price cannot be inferred. Preserve the numerator, denominator and stated income measure.
Original teaching data — canal boat counts:
| Year | Boats |
|---|---|
| 2005 | 70 |
| 2010 | 110 |
| 2015 | 90 |
Decision: Which phrase limits the claim appropriately?
Choose ONE answer.
Difficulty 1/5 · 100 coins + a small bonus on first completion today
110 is the largest displayed total. Entire history and intermediate years are absent; the first recorded interval rises from 70 to 110. Restrict a peak claim to the evidence actually available.
Original teaching data — leisure shares:
| Activity | 2015 (%) | 2025 (%) |
|---|---|---|
| การอ่าน | 30 | 20 |
| Gaming | 20 | 30 |
| Sport | 25 | 25 |
| Other | 25 | 25 |
Decision: Which detail plan is most useful?
Choose ONE answer.
Difficulty 1/5 · 100 coins + a small bonus on first completion today
Reading and gaming exchange positions, while sport and other remain equal and unchanged. A meaningful grouping shows these relationships; an isolated smallest category misses them. The data do not identify individual switches or their causes.
Original teaching data — warehouse electricity use:
| Year | สถานะ | kWh per square metre |
|---|---|---|
| 2020 | Observed | 100 |
| 2025 | Observed | 80 |
| 2030 | Projected | 70 |
Decision: Which description is accurate?
Choose ONE answer.
Difficulty 1/5 · 100 coins + a small bonus on first completion today
The measure is electricity per area, not a bill or total use. Only 2020/2025 are observed; 2030 is projected. A per-area value does not state an identical total for every building.
Original teaching data — two course surveys:
| Course | Respondents | Share satisfied (%) |
|---|---|---|
| Art | 80 | 75 |
| ดนตรี | 200 | 50 |
Decision: Which comparison accounts for both sample sizes?
Choose ONE answer.
Difficulty 1/5 · 100 coins + a small bonus on first completion today
Art has 80×75% = 60 satisfied respondents; Music has 200×50% = 100. Shares cannot be added across different samples. Compare counts and proportions separately.
Original teaching data — regional output:
| Year | Output index (2010 = 100) |
|---|---|
| 2010 | 100 |
| 2020 | 150 |
Decision: Which description respects the index?
Choose ONE answer.
Difficulty 1/5 · 100 coins + a small bonus on first completion today
An index expresses change relative to a base, not a product count or currency total. The gain is 50/100 = 50%, not 150%. Retain the base-year label in an introduction.
Original teaching data — monthly rainfall at three sites:
| Site | Rainfall in June (mm) |
|---|---|
| Hill | 120 |
| Coast | 80 |
| Valley | 40 |
Decision: Which overview avoids unsupported explanation?
Choose ONE answer.
Difficulty 1/5 · 100 coins + a small bonus on first completion today
The table ranks three June readings. Other months, weather causes and changes over time are not shown. A static comparison can be clear without inventing a trend or cause.
Original teaching data — visitor origin shares:
| Origin | 2020 (%) | 2025 (%) |
|---|---|---|
| Local | 50 | 50 |
| Elsewhere in country | 30 | 35 |
| Overseas | 20 | 15 |
Decision: Which main feature is supported?
Choose ONE answer.
Difficulty 1/5 · 100 coins + a small bonus on first completion today
Local stays at 50%; domestic non-local rises 30 to 35 and overseas falls 20 to 15. Totals are absent, so a stable local share does not establish a stable count. Overseas is well below half.
Original teaching data — separate recycling categories:
| วัสดุ | Collected (tonnes) |
|---|---|
| ใบข้อสอบ | 40 |
| แก้ว | 30 |
| Metal | 20 |
Decision: The note says other materials are omitted. Which statement is safe?
Choose ONE answer.
Difficulty 1/5 · 100 coins + a small bonus on first completion today
Paper leads the displayed categories. Their sum is 90 tonnes, but omitted categories make the city-wide total unknown. Neither an all-material percentage nor an absence of plastic follows from this selected table.
Original teaching data — bicycle ownership categories:
| ครัวเรือน | 2015 (%) | 2025 (%) |
|---|---|---|
| No bicycle | 40 | 20 |
| One bicycle | 40 | 40 |
| Two or more | 20 | 40 |
Decision: Which overview distinguishes household categories from bicycle counts?
Choose ONE answer.
Difficulty 1/5 · 100 coins + a small bonus on first completion today
No-bicycle share halves from 40 to 20; two-or-more doubles from 20 to 40. The open-ended category and unknown household totals prevent an exact bicycle count. The one-bicycle share stays at 40%.
Original teaching data — pond depth observations:
| Month | Depth (metres) |
|---|---|
| January | 2 |
| April | 3 |
| July | 2.5 |
| October | 2 |
Decision: Which broad picture is accurate?
Choose ONE answer.
Difficulty 1/5 · 100 coins + a small bonus on first completion today
Equal endpoints do not remove the rise to 3 and subsequent falls. January to April is a 50% rise, not a doubling. Report the intervening pattern as well as the unchanged endpoint.
Original teaching data — business sales in current prices:
| Year | Nominal sales (£ thousands) |
|---|---|
| 2020 | 200 |
| 2025 | 240 |
Decision: Which claim stays within the supplied measure?
Choose ONE answer.
Difficulty 1/5 · 100 coins + a small bonus on first completion today
40/200 = 20% nominal growth. Without price or volume information, real growth, item count and the price change cannot be separated. Retain the current-price qualification rather than silently reporting a real increase.
Original teaching data — two production lines:
| เส้น | Units per hour | Hours operated |
|---|---|---|
| A | 30 | 4 |
| B | 20 | 8 |
Decision: Which comparison correctly distinguishes rate from output?
Choose ONE answer.
Difficulty 1/5 · 100 coins + a small bonus on first completion today
A produces 30×4 = 120 units; B produces 20×8 = 160. A is faster per hour, while B’s longer operating time gives more output. Do not add rates to obtain a total.
Original teaching data — age-group internet use in 2025:
| Age group | Share using internet (%) |
|---|---|
| 18–29 | 95 |
| 30–49 | 90 |
| 50–69 | 70 |
Decision: Which statement correctly describes a cross-section?
Choose ONE answer.
Difficulty 1/5 · 100 coins + a small bonus on first completion today
The single-year table compares groups, not the same people over time. It provides percentages rather than group sizes. A cross-sectional age pattern does not establish individual change or a year-on-year increase.
Original teaching data — annual bus and rail journeys:
| Year | Bus (millions) | Rail (millions) |
|---|---|---|
| 2015 | 30 | 20 |
| 2020 | 25 | 25 |
| 2025 | 20 | 30 |
Decision: Which overview captures the changing relationship?
Choose ONE answer.
Difficulty 1/5 · 100 coins + a small bonus on first completion today
Bus moves 30→25→20 while rail moves 20→25→30. Equality occurs at the shown 2020 observation and the final rank reverses. The final ratio is 30/20 = 1.5, not 2. Do not invent an unobserved crossover date.
Transfer: plan from one shared library table
- Three checks reuse one new loans table: choose an overview, select supporting detail and identify an unsupported addition. It is one shared source, not three independent datasets. Read the units and dates again for each decision rather than carrying a previous question’s wording into the next one.
- A useful report does more than calculate every possible ratio. Choose comparisons that clarify the main pattern, keep the overview consistent with them and omit explanations that the source does not provide. The full writing tasks next ask you to make those decisions yourself.
Original teaching data — Marsh library loans (shared source):
| Year | Digital loans (thousands) | Print loans (thousands) |
|---|---|---|
| 2016 | 20 | 80 |
| 2020 | 40 | 70 |
| 2024 | 60 | 60 |
Decision: Which overview covers the main relationship?
Choose ONE answer.
Difficulty 1/5 · 100 coins + a small bonus on first completion today
Digital rises 20→40→60; print falls 80→70→60. Their final totals tie; combined totals are 100, 110 and 120, so not constant. This is one shared source used for three planning decisions.
Original teaching data — Marsh library loans (shared source):
| Year | Digital loans (thousands) | Print loans (thousands) |
|---|---|---|
| 2016 | 20 | 80 |
| 2020 | 40 | 70 |
| 2024 | 60 | 60 |
Decision: Which detail supports that overview?
Choose ONE answer.
Difficulty 1/5 · 100 coins + a small bonus on first completion today
80−20 = 60 thousand; final 60−60 = 0. Digital share rises from 20/100 = 20% to 60/120 = 50%, a 30-point change. Digital count rises 40/20 = 200%, while print falls. Keep counts and shares separate.
Original teaching data — Marsh library loans (shared source):
| Year | Digital loans (thousands) | Print loans (thousands) |
|---|---|---|
| 2016 | 20 | 80 |
| 2020 | 40 | 70 |
| 2024 | 60 | 60 |
Decision: Which proposed sentence should be removed for lack of evidence?
Choose ONE answer.
Difficulty 1/5 · 100 coins + a small bonus on first completion today
No app or cause is supplied. Tripling 20 gives 60; print falls 80−60 = 20; total rises 100→120. The other statements are valid, though a report must still select and group rather than list everything.
Write and revise a complete time-series report
- Use the new ferry table in the task. Write your own connected report before opening the models. Official Academic Task 1 asks for at least 150 words in about 20 minutes. You can practise untimed first, then try that allocation; the local activity does not enforce length or assess a band. Notes can help planning, but the report itself needs connected prose.
- Compare the weaker and improved reports only after drafting. Identify what each paragraph does, check its statements against the table, then revise one specific selection, grouping or evidence error in your own work. Other valid organisations and wording can work. Your draft stays on this page; copy it before leaving.
Original Academic Task 1 teaching data — annual passenger journeys in millions, three ferry routes, 2010–2025:
| Year | North route | East route | South route |
|---|---|---|---|
| 2010 | 60 | 30 | 20 |
| 2015 | 55 | 40 | 20 |
| 2020 | 45 | 50 | 25 |
| 2025 | 40 | 60 | 30 |
Write at least 150 words in connected prose. Summarise the main features and make relevant comparisons. Draft before opening the models, then revise one main-feature, evidence or grouping weakness. This local page does not grade or automatically enforce length. Your draft stays on this page; copy it before leaving.
Compare evidence and paragraph jobs, not matching phrases. Several reports can satisfy the task. The checklist does not automatically assess your writing, establish proficiency or assign a band. Return to the source for every number and qualification.
Transfer again: a one-year facilities comparison
- These fresh library-centres tables require a different report from the time series. Read the visit unit separately from the facility counts and plan your own overview. Do not reuse a trend sentence merely because it fitted the previous task. Draft at least 150 words before comparing the complete models.
- Use the annotations and criteria to revise your own report, not to replace it with memorised wording. Completing the checklist records comparison and revision; it does not independently assess your writing, demonstrate proficiency or generate an IELTS mark. If an important measure is absent from your report, repair the coverage before polishing synonyms.
Original Academic Task 1 teaching data — library centres in 2025:
| Centre | Annual visits (thousands) | Reading seats |
|---|---|---|
| Harbour | 120 | 80 |
| Meadow | 90 | 60 |
| Quarry | 60 | 40 |
| ป่า | 30 | 20 |
| Centre | Computers |
|---|---|
| Harbour | 20 |
| Meadow | 30 |
| Quarry | 20 |
| ป่า | 10 |
Write at least 150 words in connected prose. Summarise the main features and make relevant comparisons. Draft before opening the models, then revise one main-feature, evidence or grouping weakness. This local page does not grade or automatically enforce length. Your draft stays on this page; copy it before leaving.
Compare evidence and paragraph jobs, not matching phrases. Several reports can satisfy the task. The checklist does not automatically assess your writing, establish proficiency or assign a band. Return to the source for every number and qualification.
Later review: keep the measure and its base together
- After a break, try the fresh park and music-class checks before reopening worked examples. If you miss one, state exactly which column, quantity or denominator you confused. Then repair that sentence with the correct unit and source values.
- Continue with map comparisons and complete reports, process diagrams and complete reports, the language of change for precise trend sentences or answering the actual Task 2 question for a different writing purpose. General Training learners need purposeful letters, not an Academic visual report.
Original teaching data — three parks in 2025:
| Park | Area (hectares) | Annual visits (thousands) |
|---|---|---|
| Alder | 10 | 90 |
| Beech | 20 | 60 |
| Cypress | 30 | 30 |
Decision: Which comparison is accurate?
Choose ONE answer.
Difficulty 1/5 · 100 coins + a small bonus on first completion today
Alder is smallest at 10 hectares but has 90 thousand visits; Cypress reverses those rankings. Cause and growth are absent. Keep area and visits as separate measures, even when their order contrasts.
Original teaching data — weekly music-class participation:
| Year | Enrolled students | Weekly-attendance share (%) |
|---|---|---|
| 2021 | 400 | 25 |
| 2025 | 200 | 50 |
Decision: Which statement respects both denominators?
Choose ONE answer.
Difficulty 1/5 · 100 coins + a small bonus on first completion today
400×25% = 100 and 200×50% = 100. The share doubles, a rise of 25 percentage points; changing enrolment prevents the same count trend. Recalculate each year before drafting.
Select a main picture that your details can support
- Recap: introduce the visual accurately, select its main features, group meaningful comparisons and support them with correct details. Keep counts, shares, rates, sampled dates and projection status attached to their labels. A mandatory paragraph count or a fixed overview location cannot substitute for those decisions.
- Rules checked on 19 October 2026 against the official IELTS Academic Writing guide. All extension data, questions, diagrams and models are original teaching, not official or reserved test tasks. Independent subject, language, key, rights and learner reviews remain pending. No model is assigned a calibrated band, and these self-checks do not predict an official result.

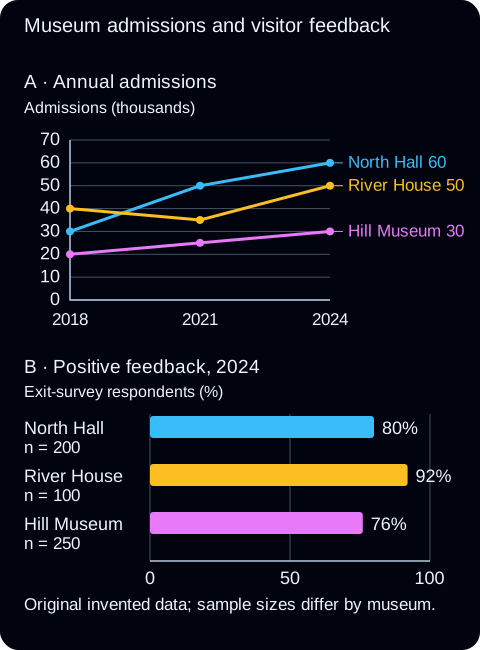
Show the supplied labels and data
Panel A — Annual admissions. Admissions (thousands).
| Museum | 2018 | 2021 | 2024 |
|---|---|---|---|
| North Hall | 30 | 50 | 60 |
| River House | 40 | 35 | 50 |
| Hill Museum | 20 | 25 | 30 |
Panel B — Positive feedback, 2024. Exit-survey respondents (%). Original invented data; sample sizes differ by museum.
| Museum | ค่าโทนสี (Value) | Respondents |
|---|---|---|
| North Hall | 80 | 200 |
| River House | 92 | 100 |
| Hill Museum | 76 | 250 |
Starting decision: Which pair of units correctly describes the two panels?
Difficulty 1/5 · 100 coins + a small bonus on first completion today
Panel A counts admissions in thousands, not distinct residents. Panel B gives positive responses as a percentage of each museum’s survey respondents. Read the unit and base separately before joining information from the two panels.
Join two panels without merging their units
- Worked mixed case: North Hall’s admissions rise from 30 to 60 thousand, making it the largest of the three museums in 2024. River House, however, has the highest positive-feedback share at 92%. A useful overview can contrast those leaders while summarising the admissions changes. One panel need not repeat the other panel’s ranking.
- A weak claim, “North Hall was the most successful museum in every respect”, overlooks the feedback panel. Improve the claim by naming the specific measures: the largest admissions total and the highest positive-response share belong to different sites. An enthusiastic therefore cannot invent a missing causal link.
Show the supplied labels and data
Panel A — Annual admissions. Admissions (thousands).
| Museum | 2018 | 2021 | 2024 |
|---|---|---|---|
| North Hall | 30 | 50 | 60 |
| River House | 40 | 35 | 50 |
| Hill Museum | 20 | 25 | 30 |
Panel B — Positive feedback, 2024. Exit-survey respondents (%). Original invented data; sample sizes differ by museum.
| Museum | Value | Respondents |
|---|---|---|
| North Hall | 80 | 200 |
| River House | 92 | 100 |
| Hill Museum | 76 | 250 |
- The respondent samples differ: 200 at North Hall, 100 at River House and 250 at Hill Museum. The percentages describe those responses, not all admissions. Even a combined sample calculation would concern the sampled respondents; it would not become an estimate of satisfied admission events without additional evidence.
Show the supplied labels and data
Panel A — Annual admissions. Admissions (thousands).
| Museum | 2018 | 2021 | 2024 |
|---|---|---|---|
| North Hall | 30 | 50 | 60 |
| River House | 40 | 35 | 50 |
| Hill Museum | 20 | 25 | 30 |
Panel B — Positive feedback, 2024. Exit-survey respondents (%). Original invented data; sample sizes differ by museum.
| Museum | ค่าโทนสี (Value) | Respondents |
|---|---|---|
| North Hall | 80 | 200 |
| River House | 92 | 100 |
| Hill Museum | 76 | 250 |
Guided decision: Which cross-panel overview is supported?
Difficulty 1/5 · 100 coins + a small bonus on first completion today
North Hall has 60 thousand admissions in 2024, above River House’s 50 and Hill Museum’s 30. River House leads the feedback shares at 92%, compared with 80% and 76%. These rankings can be contrasted; the panels do not establish a causal link or that the survey samples represent all admissions.
Read each panel's dates before extending a trend
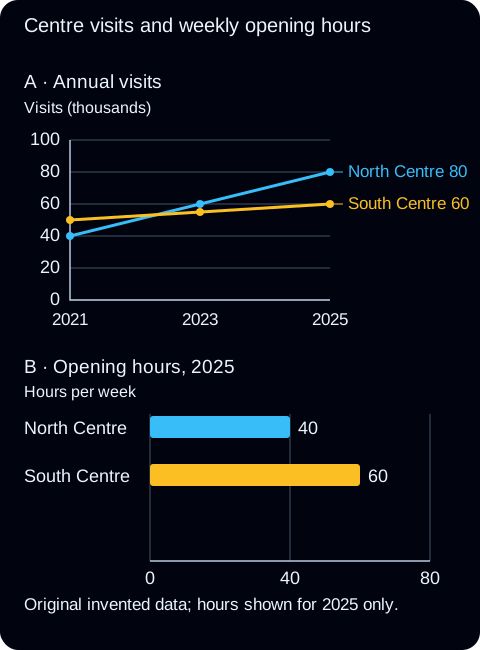
- For a new two-panel display, note the date range and unit of each panel before drafting. A multi-year visits line does not turn a one-year opening-hours bar into a time series.
- Try the fresh centre decision before reading its explanation. Compare the claims against both panels. A correct first attempt is evidence for this written decision, not a prediction of a full Writing band.

Show the supplied labels and data
Panel A — Annual visits. Visits (thousands).
| Centre | 2021 | 2023 | 2025 |
|---|---|---|---|
| North Centre | 40 | 60 | 80 |
| South Centre | 50 | 55 | 60 |
Panel B — Opening hours, 2025. Hours per week. Original invented data; hours shown for 2025 only.
| Centre | ค่าโทนสี (Value) |
|---|---|
| North Centre | 40 |
| South Centre | 60 |
Fresh independent decision: Which statement reports both panels without extending their evidence?
Difficulty 1/5 · 100 coins + a small bonus on first completion today
North has 80 thousand visits versus South’s 60 in 2025, while weekly opening hours are 40 versus 60. The time series shows visits, not historical opening hours, so no hours trend is supplied. The different final-year rankings do not prove that opening hours caused the visits pattern.
Transfer to a complete mixed-chart report
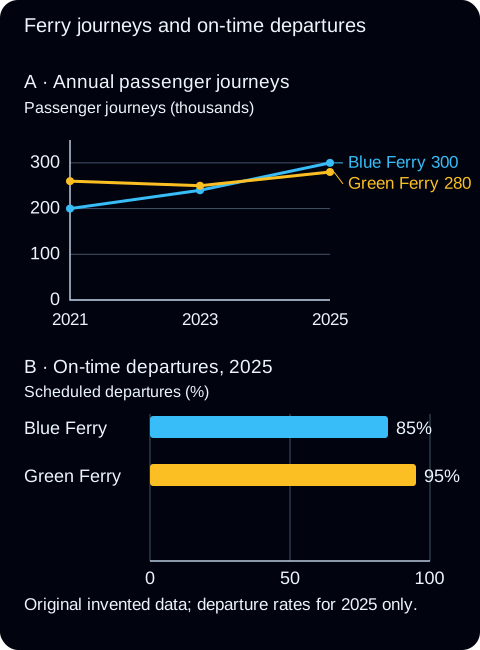
- Write your own connected English report for the new ferry display in the practice below. Keep the passenger-journey totals separate from percentages of departures; a journey and a departure are different count bases.
- After your attempt, open the weaker/improved comparison, identify one inaccurate claim in your own wording and revise it. Alternative organisations can work. The supplied illustration is not a script to memorise or an independently rated exemplar.

Show the supplied labels and data
Panel A — Annual passenger journeys. Passenger journeys (thousands).
| ออปレーター | 2021 | 2023 | 2025 |
|---|---|---|---|
| Blue Ferry | 200 | 240 | 300 |
| Green Ferry | 260 | 250 | 280 |
Panel B — On-time departures, 2025. Scheduled departures (%). Original invented data; departure rates for 2025 only.
| ออปレーター | ค่าโทนสี (Value) |
|---|---|
| Blue Ferry | 85 |
| Green Ferry | 95 |
New-context written transfer: Write an English Academic Task 1 practice report of at least 150 words in connected prose. Describe both displays, select a main picture and support relevant comparisons with supplied values. Try your own report before opening the comparison. Then revise one cross-panel claim after checking its date, unit and base. This local self-review does not produce a band estimate.
Use the model and criteria to compare and revise your report; several organisations are valid. This records written self-review, not independent assessment or an IELTS result.
Retrieve the relationship, then change the context
- Tomorrow, return to one of the fresh displays and state an overview without the model. Check which panel supports each clause. A few days later, use another display and explain one cross-panel claim that its data cannot support; then revise a sentence in your report.
- Continue to precise language for change, map reports or process reports for a different reporting problem. General Training uses purposeful letters.
- Mixed-visual scope checked on 20 October 2026 against the official IELTS Academic Writing guide. All three displays, questions and report illustrations are original local practice; independent subject, language, key, rights and learner review remain pending.