Uncertainty, gradients and model testing
Introduzido| English | Significado |
|---|---|
| systematic error/ˌsɪstəˈmætɪk ˈerə/ | Erro sistemático |
| uncertainty/ʌnˈsɜːtənti/ | incerteza |
| sample/ˈsæmpl/ | A subset of a population selected for observation, measurement or analysis. |
| hypothesis/haɪˈpɒθəsɪs/ | A proposed explanation or prediction that can be tested using evidence. |
| quadrat/ˈkwɒdræt/ | A frame marking a known area used to sample the abundance or distribution of organisms. |
| systematic sampling/ˌsɪstəˈmætɪk ˈsæmplɪŋ/ | Taking samples at regular intervals, such as along a transect. |
| transect/trænˈsekt/ | A line or strip along which observations or samples are taken to study changes across a habitat. |
| representative/ˌreprɪˈzentətɪv/ | Reflecting the relevant characteristics of the larger group or population. |
| questionnaire | A fixed set of written questions used to collect data from people. |
| informed consent/ɪnˈfɔːmd kənˈsent/ | Voluntary agreement to participate after receiving and understanding information about what participation involves and its relevant risks. |
| standard deviation/ˈstændəd ˌdiːvɪˈeɪʃn/ | A measure of spread equal to the square root of the variance. |
| kite diagram | A graph showing how species abundance changes along a transect. |
What would explain this observation?
- A line passing near every data point is useful, but its gradient can still be uncertain. A graph is evidence for a model within the measurement range.
Build the model
- Random variation makes repeated readings differ.
- Systematic error 系统误差 shifts results consistently.
- Absolute uncertainty 不确定度 has the measured unit; relative or percentage uncertainty compares uncertainty with the measured value.
- uncertainty: A quantified limitation on a measured result.
- systematic error: A consistent measurement bias.

Which is most likely a systematic error?
Dificuldade 1/5 · Moedas 100 + pequeno bônus na primeira conclusão hoje
A fixed 0.20 g balance zero offset is a systematic error. Independent repeats reduce random uncertainty in the mean, not scatter in individual readings or a shared offset. Reaction timing can have both random and systematic contributions.
Match each technical term to its precise meaning.
Dificuldade 2/5 · Moedas 140 + pequeno bônus na primeira conclusão hoje
Use the definitions to distinguish related quantities and processes.
Choose evidence that can test it
- For a product or quotient, adding fractional uncertainties is a common maximum-uncertainty approximation.
- For a difference, add absolute uncertainties.
- A nonzero intercept can reveal an offset or an incomplete model.
In the lab: Show units on axes and choose a sensible scale. Plot uncertainty bars where justified, draw a best-fit line rather than joining every point, and estimate steepest and shallowest plausible gradients when the course method calls for them.
Which two habits make the investigation or model in this case more defensible?
Dificuldade 2/5 · Moedas 140 + pequeno bônus na primeira conclusão hoje
Stating the conditions and assumptions lets others repeat the work exactly, and recording the supporting evidence lets them check the conclusion. Hiding disagreeing results removes the evidence that could challenge a wrong conclusion, and one measurement can never establish a wider claim.
Work from known quantities
- Known: length = 50.0 mm with uncertainty 1.0 mm.
- Percentage uncertainty = absolute uncertainty/value ×100 = 1.0/50.0×100 = 2.0%.
- For a quotient of two independently measured quantities with maximum percentage uncertainties 2% and 3%, the summed maximum estimate is 5%.
Your turn: A 40 cm reading has an absolute uncertainty of 1 cm. Find percentage uncertainty.
Measurement ranges and the quotient estimate
50 ± 1 mm has a 2% uncertainty. Compare it with a 100 ± 3 mm reading: the summed quotient estimate is 5%, while exact endpoint calculations reveal a slightly asymmetric range.
A 40 cm reading has an absolute uncertainty of 1 cm. Find percentage uncertainty.
Dificuldade 2/5 · Moedas 140 + pequeno bônus na primeira conclusão hoje
The result is 2.5 %. Known: reading 40 cm; absolute uncertainty 1 cm. Use percentage uncertainty = absolute uncertainty / value x 100. Percentage uncertainty = 1/40 x 100 = 2.5%. Smaller measured values carry larger percentage uncertainties for the same absolute uncertainty.
Check the conclusion and its limits
- Repeating readings reduces random uncertainty in a mean but does not automatically remove a zero error.
- Do not quote more decimal places than your measurement can support.
Not true: Repeating a measurement always removes a calibration offset. Independent repeats and averaging can reduce random uncertainty of the mean, while a calibration offset can remain. Check calibration and apply a justified correction where appropriate.
- Random variation makes repeated readings differ.
- For a product or quotient, adding fractional uncertainties is a common maximum-uncertainty approximation.
- Watch for: repeating readings reduces random uncertainty in a mean but does not automatically remove a zero error.
Repeating a measurement always removes a calibration offset.
Dificuldade 1/5 · Moedas 100 + pequeno bônus na primeira conclusão hoje
Independent repeats and averaging can reduce random uncertainty of the mean, while a calibration offset can remain. Check calibration and apply a justified correction where appropriate.
A quantified limitation on a measured result: write the technical term.
Dificuldade 1/5 · Moedas 100 + pequeno bônus na primeira conclusão hoje
uncertainty means A quantified limitation on a measured result.
Write from a percentage uncertainty of 5 percent
- A reading is 80 cm and the absolute uncertainty is 4 cm.
- Find the percentage uncertainty. Repeating a measurement does not remove a calibration offset.
A reading is 80 cm and the absolute uncertainty is 4 cm. What is the percentage uncertainty, and what does repeating the measurement not remove?
Percentage uncertainty is the absolute uncertainty divided by the reading, then multiplied by 100. Systematic offsets survive averaging.
A measured reading is 80 cm with an absolute uncertainty of 4 cm. What is the percentage uncertainty?
Dificuldade 1/5 · Moedas 100 + pequeno bônus na primeira conclusão hoje
Percentage uncertainty = absolute uncertainty/reading × 100 = 4 cm/80 cm × 100 = 5%. The centimetre units cancel. Neither the uncertainty of 4 cm nor the reading of 80 cm is itself a percentage.
Frame a question that evidence can answer
- Name the explanatory variable, response, population, place and sampling 样本 period. In observational fieldwork the explanatory variable is compared, not necessarily manipulated.
- Example: how does lichen species richness per trunk vary with distance from a specified road on one survey date? Distance is not itself a direct measurement of air pollution.
Which response fits that question?
Dificuldade 1/5 · Moedas 100 + pequeno bônus na primeira conclusão hoje
Define a response that can be measured consistently rather than substituting an opinion.
Separate a prediction from its mechanism
- A hypothesis 假设 predicts a pattern and proposes a reason. Reduced traffic pollution could favour some lichens farther from a road, but nutrients, bark, moisture and species tolerances also matter.
- A null model for a rank test can be no association between the variables. Rejecting it does not establish the proposed pollution mechanism.
What would a positive distance-richness association establish?
Dificuldade 1/5 · Moedas 100 + pequeno bônus na primeira conclusão hoje
A statistical association and a causal explanation require different evidence.
Plan controls and record confounders
- Use a consistent trunk height, sampled area, aspect and identification method; choose comparable tree species where feasible. Record weather, shade, age and bark conditions.
- A confounder can influence both site selection and the response. Standardising some conditions improves comparability without guaranteeing that every competing cause is removed.
Why record tree species?
Dificuldade 1/5 · Moedas 100 + pequeno bônus na primeira conclusão hoje
A recorded covariate helps assess competing explanations; it does not erase them.
Choose the independent sampling unit
- Ten readings on one tree are repeated measurements of one tree. They are not ten independent trees representing a region.
- Likewise, many water samples from one stream do not provide independent stream replication. Define the level of inference and sample independent sites at that level where possible.
Does measuring one tree ten times give ten independent trees?
Dificuldade 1/5 · Moedas 100 + pequeno bônus na primeira conclusão hoje
Pseudoreplication overstates the amount of independent information.
Make random selection operational
- Define the sampling area and an eligible sampling frame, then use random coordinates or identifiers. Specify inaccessible-site rules before seeing results.
- Random selection reduces observer choice bias; one small random sample can still miss a rare habitat. Do not move a quadrat 样方 because its vegetation looks inconvenient.
Which action undermines random sampling?
Dificuldade 1/5 · Moedas 100 + pequeno bônus na primeira conclusão hoje
Selecting results after seeing the vegetation introduces observer bias.
Use systematic sampling 系统抽样 for gradients
- Regularly spaced quadrats along a transect 样带 help display spatial change. Choose an appropriate start, spacing and number of transects for the question.
- A random start can reduce arbitrary placement. Periodic habitat patterns matching the spacing and spatial autocorrelation can still affect representativeness and independence.
What is one risk of regular spacing?
Dificuldade 1/5 · Moedas 100 + pequeno bônus na primeira conclusão hoje
A systematic design needs justification; regular spacing alone is not a guarantee.
Stratify and weight explicitly
- Divide the field into meaningful strata, then select locations within each, normally randomly. Proportional allocation can simplify a whole-field estimate.
- For an invented field that is one-third wet and two-thirds dry, allocate four and eight of twelve equal-area quadrats respectively. The diagram illustrates designs, not actual random draws.
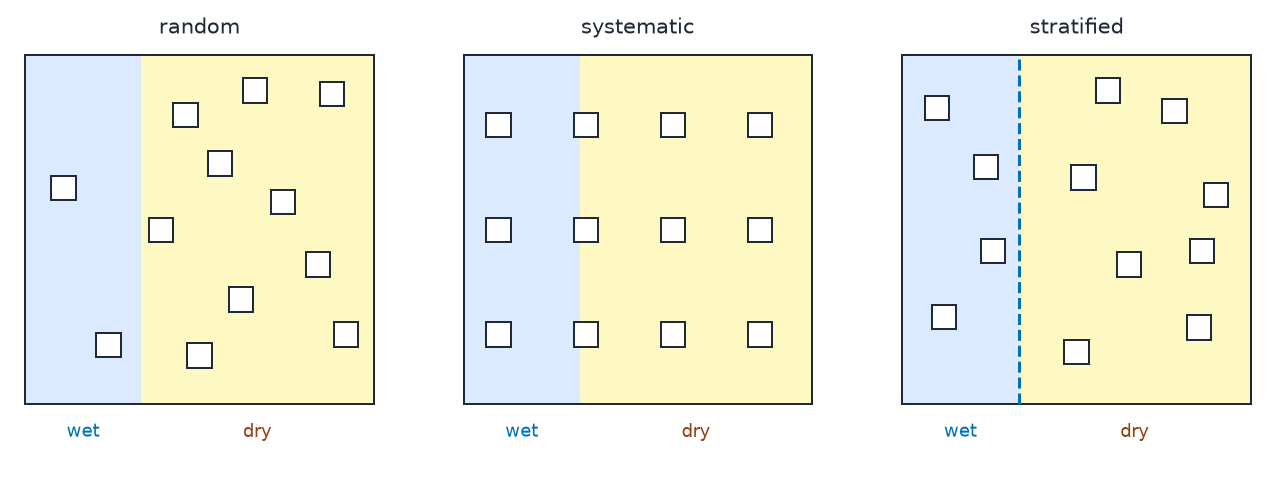
One third of a field is wet and two thirds dry. How many of twelve equal-area quadrats should go in the wet third under proportional allocation?
Dificuldade 1/5 · Moedas 100 + pequeno bônus na primeira conclusão hoje
Twelve multiplied by one third equals four; unequal allocation requires appropriate weighting.
Avoid an unweighted pooling error
- Invented mean densities are 2 plants/m² in the wet third and 8 plants/m² in the dry two-thirds. Whole-field density is (1/3 × 2) + (2/3 × 8) = 6 plants/m².
- Sampling equal numbers in the two strata would produce an unweighted average of 5. Use area weights for the whole-field estimate rather than treating the differently sized strata as equal.
A field is one third wet with mean density 2 plants/m², and two thirds dry with mean density 8 plants/m². Which estimate represents the whole field?
Dificuldade 1/5 · Moedas 100 + pequeno bônus na primeira conclusão hoje
Weight by area: (1/3 × 2) + (2/3 × 8) = 2/3 + 16/3 = 6 plants/m². The unweighted mean (2 + 8)/2 = 5 plants/m² incorrectly gives the two strata equal area.
Find whole-field plants per square metre when one third has density 2 and two thirds has density 8.
Dificuldade 2/5 · Moedas 140 + pequeno bônus na primeira conclusão hoje
Whole-field density = wet area fraction × wet density + dry area fraction × dry density = (1/3 × 2) + (2/3 × 8) = 2/3 + 16/3 = 6 plants/m².
Scale a quadrat estimate with units
- Invented counts in ten 1 m² quadrats total 30 dandelions. Sampled area is 10 m², so mean density is 3 plants/m².
- For a 4000 m² field the estimate is 12 000 plants. Its usefulness depends on a representative 有代表性的 design and uncertainty, not on assuming every square metre has the same count.
What must be justified before scaling to the field?
Dificuldade 1/5 · Moedas 100 + pequeno bônus na primeira conclusão hoje
A representative mean can estimate an uneven population; uniform distribution is not required.
Ten 1 m² quadrats contain 30 plants in total. Estimate plants in a representative 4000 m² field.
Dificuldade 2/5 · Moedas 140 + pequeno bônus na primeira conclusão hoje
Sampled area = 10 × 1 m² = 10 m². Mean density = 30/10 = 3 plants/m². Estimated field abundance = 3 × 4000 = 12000 plants, assuming representative quadrats.
Distinguish two sampling curves
- A species-area curve increases the area of a sample; a species-accumulation curve adds sampling units or effort. State which horizontal axis you are using.
- A flattening curve can suggest diminishing returns in the sampled habitat. It does not prove all habitats, seasons or rare species are represented. Pilot variability and required precision also guide sample size.
Does a plateau prove a complete regional species list?
Dificuldade 1/5 · Moedas 100 + pequeno bônus na primeira conclusão hoje
An apparent plateau is conditional on the sampling method and area.
Distinguish a line from a belt transect
- A line transect records organisms touching or encountered along a line under a stated rule. A belt samples a strip, often using quadrats along it.
- State distance, spacing, strip width and cover or abundance method. Repeat independent transects if the question concerns the broader habitat rather than one chosen path.
What defines a belt rather than a simple line?
Dificuldade 1/5 · Moedas 100 + pequeno bônus na primeira conclusão hoje
Geometry and sampling rules determine what area and organisms are represented.
Match the abiotic method to the quantity
- A calibrated oxygen probe or a suitable titration measures dissolved oxygen. A Secchi disc measures transparency depth; it does not directly report instrument turbidity units.
- Oxygen saturation depends on temperature and other conditions. Actual oxygen also reflects mixing, photosynthesis and respiration; warm water does not determine every observed concentration alone.
What does a Secchi reading directly measure?
Dificuldade 1/5 · Moedas 100 + pequeno bônus na primeira conclusão hoje
Keep the measured quantity and units distinct from related environmental properties.
Keep soil mass denominators visible
- Invented net soil masses after removing the container tare: wet 30 g, oven-dry 24 g, residue after prescribed ignition 21.6 g. Water loss is 6 g.
- Wet-basis moisture is 6/30 × 100 = 20%; dry-basis moisture is 6/24 × 100 = 25%. State the basis because both calculations can be legitimate and answer different definitions.
Net wet soil mass is 30 g and oven-dry mass is 24 g. Why can moisture percentages of 20% and 25% both be correct?
Dificuldade 1/5 · Moedas 100 + pequeno bônus na primeira conclusão hoje
Lost water mass = 30 − 24 = 6 g. Wet-basis moisture = 6/30 × 100 = 20%; dry-basis moisture = 6/24 × 100 = 25%. The water mass is unchanged; the reference mass differs.
Net wet soil mass is 30 g and oven-dry mass is 24 g, excluding the container. Find wet-basis moisture percentage.
Dificuldade 2/5 · Moedas 140 + pequeno bônus na primeira conclusão hoje
Water mass = wet − dry mass = 30 − 24 = 6 g. Wet-basis moisture = water mass/wet mass × 100 = 6/30 × 100 = 20%.
Interpret loss on ignition cautiously
- Using the invented dry mass 24 g and residue 21.6 g, loss on ignition is 2.4/24 × 100 = 10% of dry mass.
- This is not automatically 10% organic carbon. Heating protocol, structural water and carbonates can affect loss; report the method and limitations and follow teacher-approved laboratory procedures.
Does 10% loss on ignition directly establish 10% organic carbon?
Dificuldade 1/5 · Moedas 100 + pequeno bônus na primeira conclusão hoje
A proxy needs a defensible relationship to the target quantity and known interferences.
Net oven-dry soil mass is 24 g and post-ignition residue is 21.6 g, excluding the container. Find mass loss as a percentage of dry mass.
Dificuldade 2/5 · Moedas 140 + pequeno bônus na primeira conclusão hoje
Mass loss = 24 − 21.6 = 2.4 g. Loss as percentage of dry mass = 2.4/24 × 100 = 10%. This is not automatically the organic-carbon percentage.
Design social evidence without leading respondents
- Pilot a questionnaire 问卷, define the target population and sampling method, and avoid wording that presupposes a preferred answer. Closed questions aid comparison; open questions reveal reasons.
- Plan informed consent 知情同意, anonymity or confidentiality as appropriate, secure storage and withdrawal arrangements. Explain non-response and access biases rather than calling a convenience sample representative.
Which question is less leading?
Dificuldade 1/5 · Moedas 100 + pequeno bônus na primeira conclusão hoje
Neutral wording allows disagreement; it does not assume the investigator’s judgement.
Make risk and ethics part of the method
- Identify hazards, who may be harmed, precautions and residual risk. Plan safe access, weather limits and minimal habitat disturbance before collecting data.
- For people, informed voluntary participation and appropriate privacy matter. For habitats, avoid unnecessary removal, trampling or release of organisms and follow local permissions.
When should risk assessment occur?
Dificuldade 1/5 · Moedas 100 + pequeno bônus na primeira conclusão hoje
Risk and ethical planning shape the method rather than merely decorating the final report.
Separate measurement scatter from biological variation
- Repeated readings can differ because of random measurement effects. Counts among different quadrats can also vary because the organisms themselves are unevenly distributed.
- More independent samples can improve precision of an estimated mean; averaging does not remove natural variability from the habitat or automatically improve calibration.
Does a smaller standard error mean individual organisms became more alike?
Dificuldade 1/5 · Moedas 100 + pequeno bônus na primeira conclusão hoje
Distinguish an estimate’s uncertainty from variability among sampled units.
Calculate and label a half-range
- Invented oxygen readings are 8.2, 8.6, 8.0, 8.4 and 8.3 mg/L. Their mean is 41.5/5 = 8.3 mg/L and their half-range is (8.6 − 8.0)/2 = 0.3 mg/L.
- If using the course’s half-range convention, write mean ± half-range and state the method. The 0.3 mg/L is not automatically a confidence interval, standard error or instrument specification.
Oxygen readings are 8.2, 8.6, 8.0, 8.4 and 8.3 mg/L. The reported interval uses mean ± half the observed range. What does the calculated 0.3 mg/L represent?
Dificuldade 1/5 · Moedas 100 + pequeno bônus na primeira conclusão hoje
Half-range = (maximum − minimum)/2 = (8.6 − 8.0)/2 = 0.3 mg/L. This descriptive spread is not automatically a confidence interval, standard error or instrument specification.
Distinguish SD from SE
- For those five oxygen readings, squared deviations from 8.3 sum to 0.20. Sample SD = √(0.20/4) ≈ 0.224 mg/L.
- For independent observations under a suitable model, SE of the mean = SD/√5 = 0.100 mg/L. SD describes spread among observations; SE describes precision of the estimated mean.
Which statistic describes spread among the sampled observations?
Dificuldade 1/5 · Moedas 100 + pequeno bônus na primeira conclusão hoje
The two statistics answer different questions even though both use the measured unit.
For independent observations, sample SD is 4 units and n is 100. Find SE of the mean.
Dificuldade 2/5 · Moedas 140 + pequeno bônus na primeira conclusão hoje
4/√100=0.4 units.
Read what an error bar means
- The invented groups shown have means 10 and 12, SD 4, and n = 100 per group. Each SE is 4/√100 = 0.4.
- The left SD bars overlap; the right SE bars do not. Identify bar type and assumptions before inference. Overlap of SD bars is not a universal test of a difference in means.
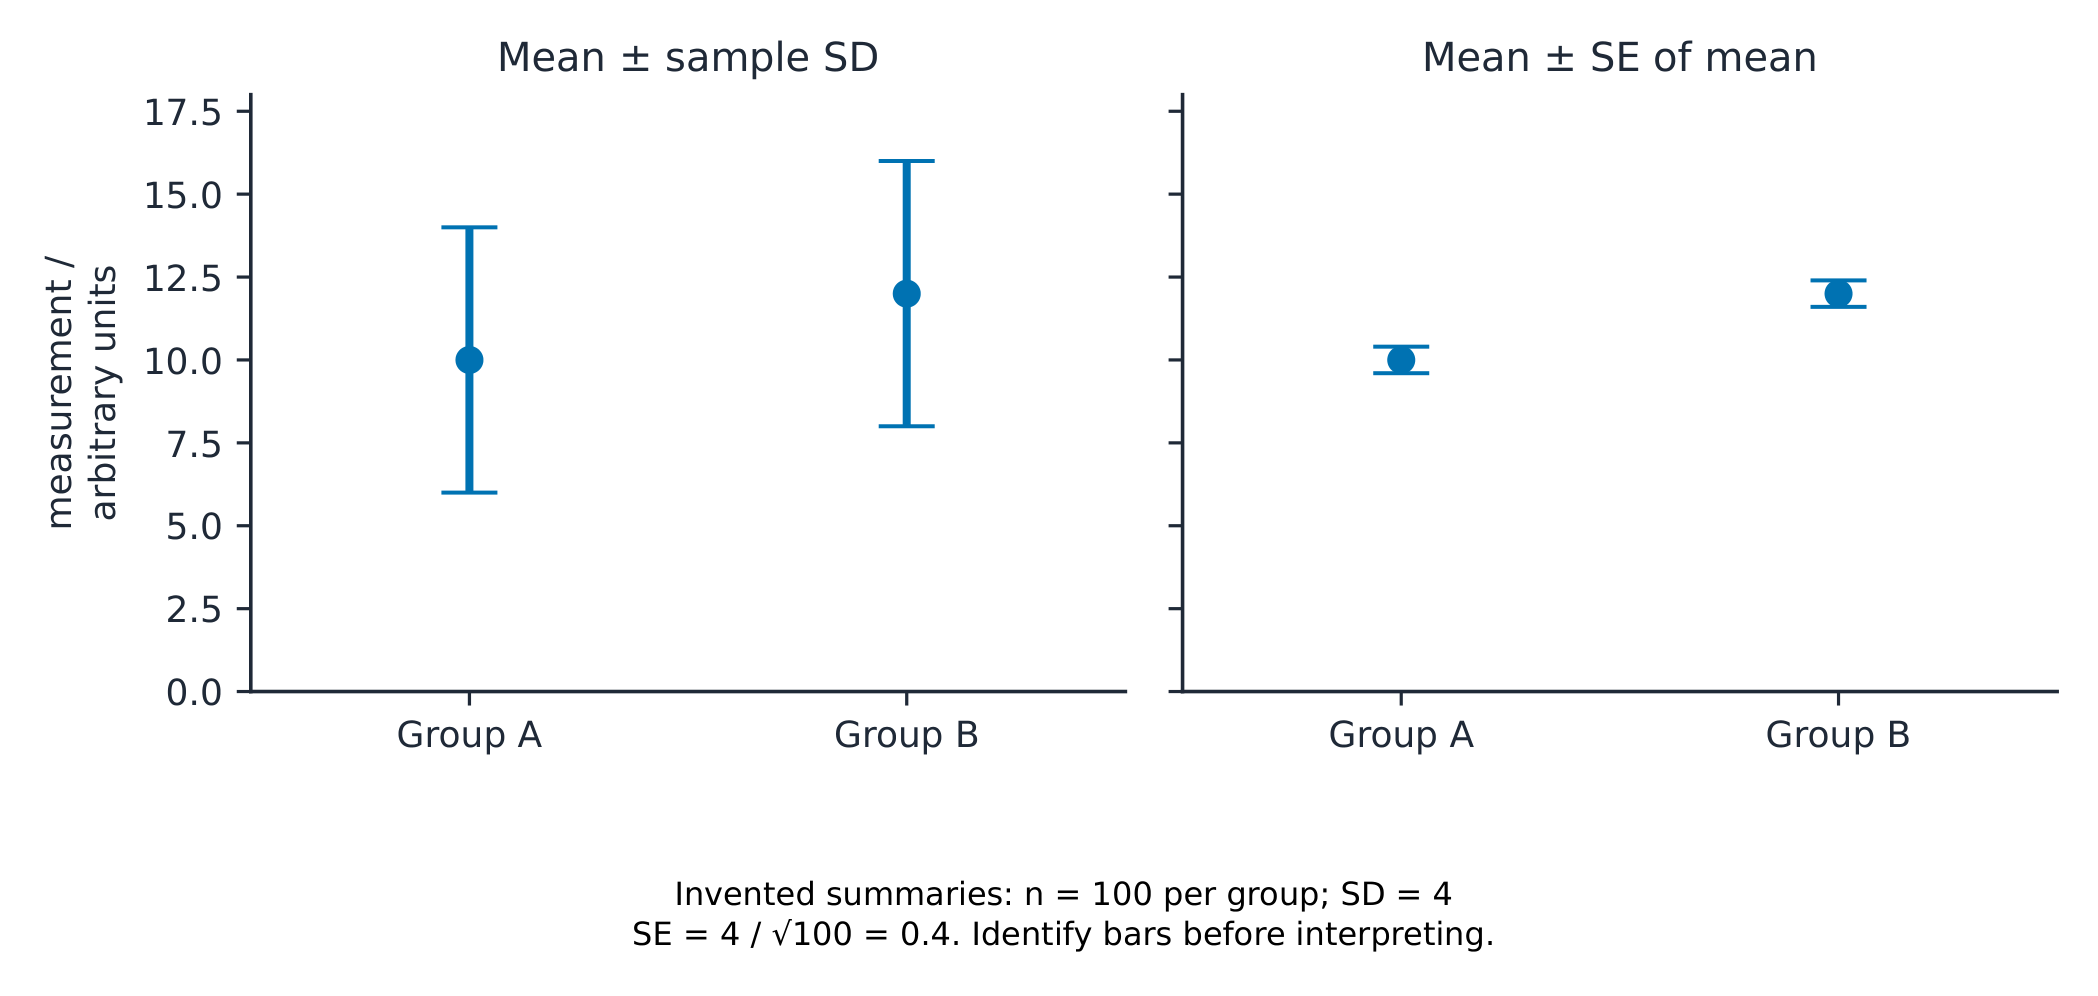
Can overlapping SD bars alone establish no significant mean difference?
Dificuldade 1/5 · Moedas 100 + pequeno bônus na primeira conclusão hoje
Individual spread and precision of means are distinct; interval type matters.
Check uncertainty propagation assumptions
- For sums or differences, adding absolute uncertainty bounds is a conservative worst-case approximation. For products or quotients, add fractional bounds when uncertainties are small.
- Independent random standard uncertainties are often combined in quadrature instead; correlated errors need different treatment. State the convention and avoid silently mixing bounds with standard deviations 标准差.
Is the sum of percentage bounds automatically the standard uncertainty?
Dificuldade 1/5 · Moedas 100 + pequeno bônus na primeira conclusão hoje
A course approximation must be labelled rather than presented as every statistical rule.
Choose graph axes and a suitable model
- Give quantities, units, a readable scale and justified uncertainty bars. A scatter plot displays paired numerical observations; a fitted line expresses a model.
- Do not connect unrelated sites as if the connecting segments were measured. Gradients and intercepts require units and interpretation; restrict predictions to justified ranges.
Does a best-fit line prove the model outside the measured range?
Dificuldade 1/5 · Moedas 100 + pequeno bônus na primeira conclusão hoje
Fit within observations is not independent evidence for extrapolation.
Read a kite diagram 风筝图 as a spatial pattern
- Kite width represents percentage cover along the stated transect. In this invented example, marram spans 10–60 m and peaks at 70% at 30 m; heather spans 50–100 m.
- Zonation is a spatial pattern. It can motivate hypotheses about succession, salt, moisture or soil, but a single spatial survey does not directly observe change through time.
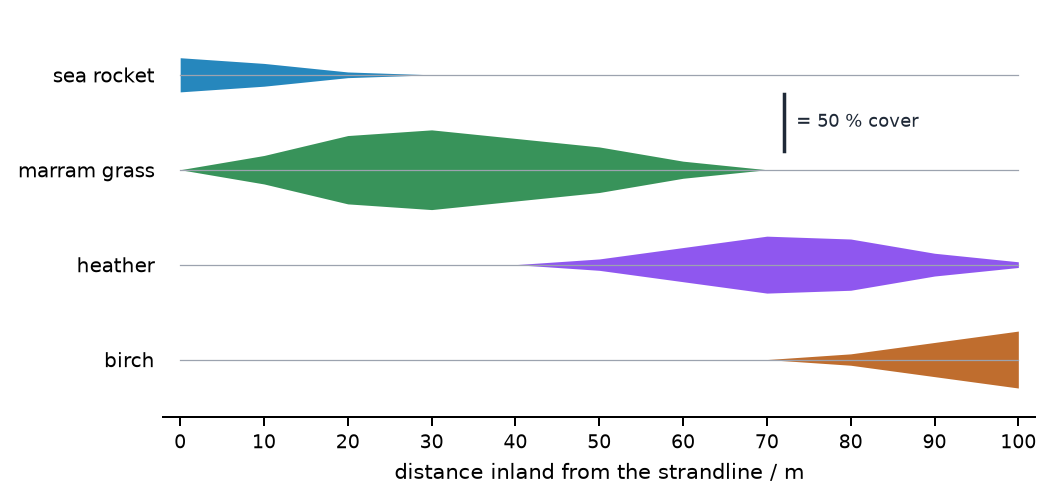
Does a kite transect directly document years of succession?
Dificuldade 1/5 · Moedas 100 + pequeno bônus na primeira conclusão hoje
A proposed space-for-time interpretation needs supporting assumptions and evidence.
Rank paired data consistently
- The invented lichen distances are 5, 10, 20, 40, 60, 80, 100 and 150 m; richness values are 1, 3, 2, 4, 7, 5, 8 and 9. Rank both variables in the same direction.
- Richness ranks are 1, 3, 2, 4, 6, 5, 7, 8; squared rank differences total 4. With ties, assign average ranks and use an appropriate tied-rank method rather than blindly applying the untied formula.
For eight paired observations, distance ranks are 1, 2, 3, 4, 5, 6, 7, 8 and richness ranks are 1, 3, 2, 4, 6, 5, 7, 8. What is the sum of squared rank differences?
Dificuldade 1/5 · Moedas 100 + pequeno bônus na primeira conclusão hoje
Paired rank differences are 0, −1, 1, 0, −1, 1, 0, 0. Their squares sum to 0 + 1 + 1 + 0 + 1 + 1 + 0 + 0 = 4. Pair observations before subtracting ranks.
Calculate and interpret Spearman’s coefficient
- With n = 8 and sum of squared rank differences 4, the untied formula gives rₛ = 1 − 6×4/[8×(8²−1)] = 20/21 ≈ 0.952.
- This is a strong positive monotonic association in these data. The coefficient is not 95.2% of variation explained and does not identify a causal mechanism.
Which description fits rₛ ≈ 0.952?
Dificuldade 1/5 · Moedas 100 + pequeno bônus na primeira conclusão hoje
A rank coefficient is a measure of association rather than a causal probability.
Keep alpha and p distinct
- Alpha is a significance threshold chosen before evaluating the result. Under a specified null model, a p-value is the probability of a test statistic at least as extreme as the observed one.
- It is not the probability that the null is true or that chance caused the result. A two-sided critical value 0.738 for eight pairs at alpha 0.05 is a decision threshold, not a measured p-value.
What is alpha = 0.05?
Dificuldade 1/5 · Moedas 100 + pequeno bônus na primeira conclusão hoje
Separate the decision rule from the statistic calculated for the observed data.
Make the null model and independence explicit
- For independent exchangeable untied ranks under the null, the eight-pair lichen example has 46 equally or more extreme permutations among 40 320 possibilities: two-sided p ≈ 0.00114.
- Nearby trees may share conditions, violating independence. A small p-value under an inappropriate model does not repair poor sampling, confounding or selective reporting.
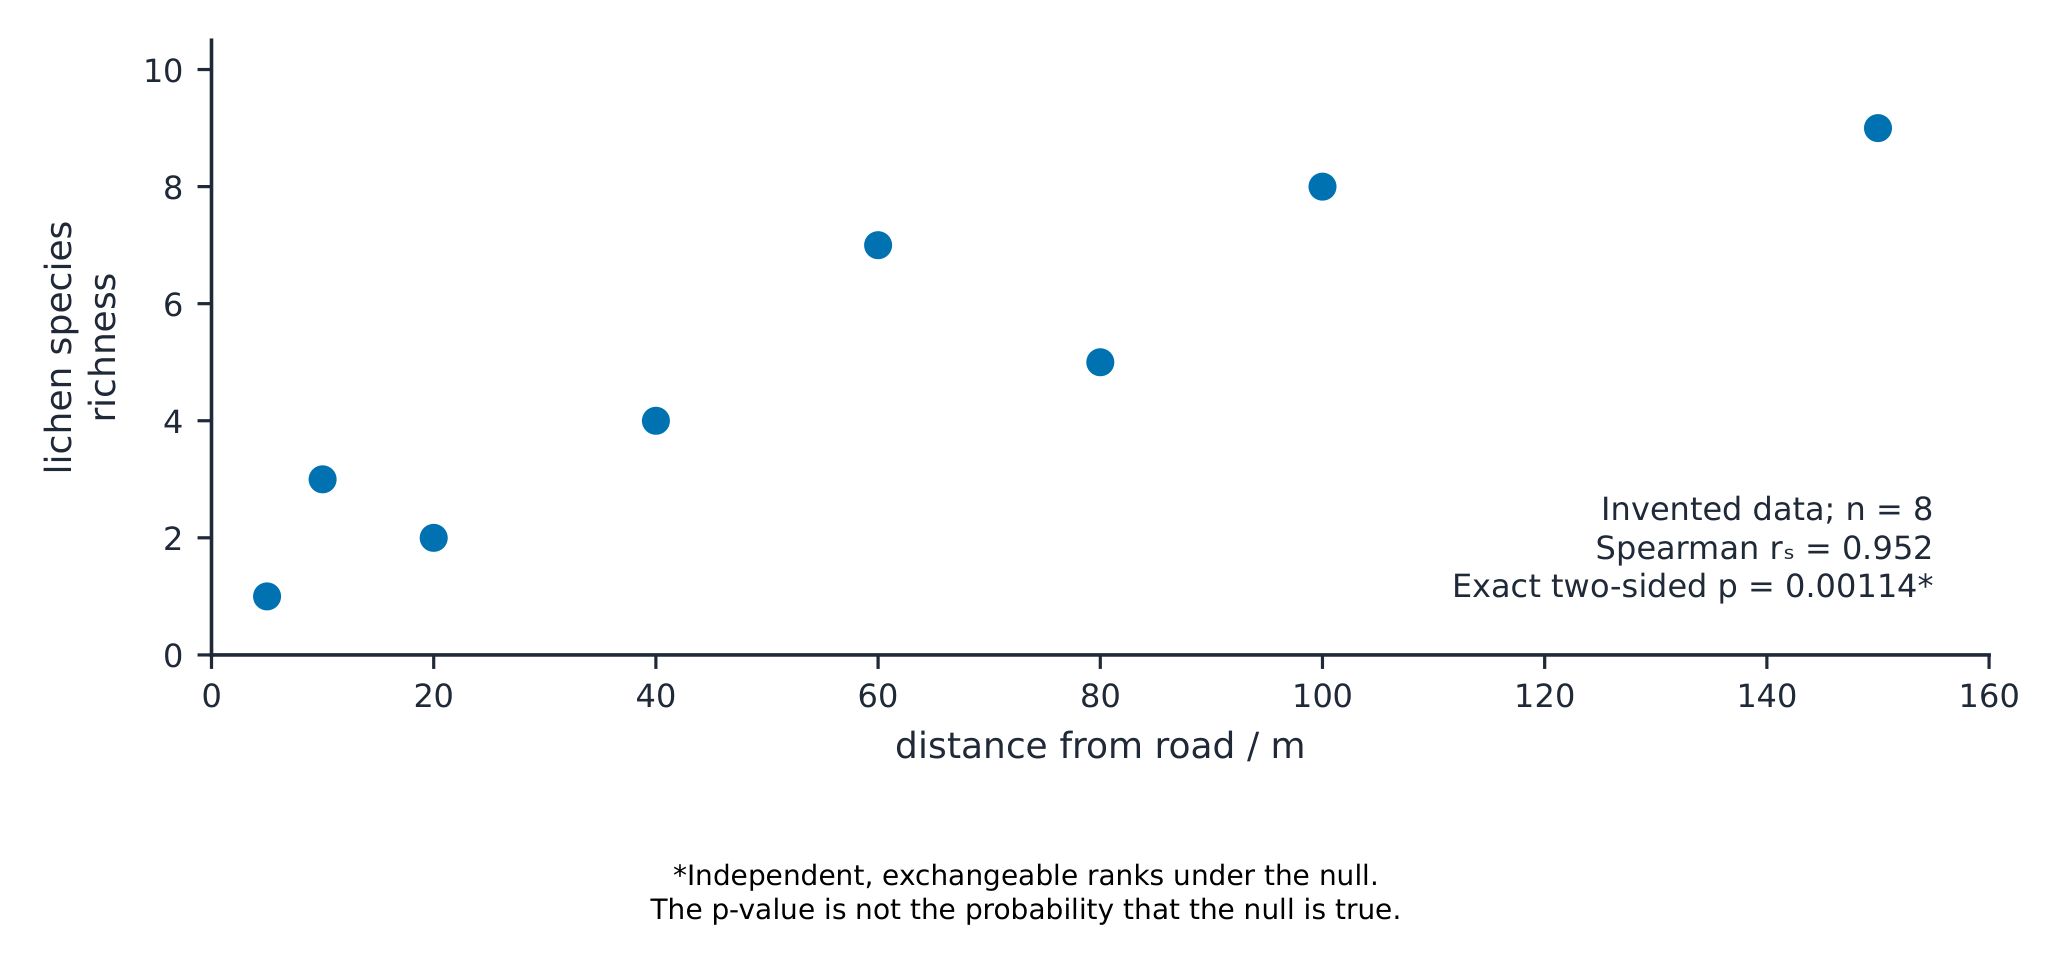
Can an exact permutation calculation repair non-independent sampling by itself?
Dificuldade 1/5 · Moedas 100 + pequeno bônus na primeira conclusão hoje
A mathematically exact result is conditional on a scientifically appropriate model.
Distinguish evidence, effect and importance
- A statistically significant association is evidence against the specified null under the assumptions. It does not establish that an effect is large, ecologically important or caused by the proposed factor.
- Failing to reject is not proof of no relationship. Sample size, variability, power, nonlinearity and measurement quality can limit what a test detects.
What follows from failing to reject a null?
Dificuldade 1/5 · Moedas 100 + pequeno bônus na primeira conclusão hoje
A non-significant result is not proof of exact absence.
Evaluate a limitation through its effect
- Specify the weakness, the likely consequence and a feasible improvement. Mixed tree species could confound distance with bark conditions; comparable species and recorded covariates help assess it.
- More trees of one species at independent sites improves that design; simply repeating readings on one tree does not. Seasonal repeat visits answer temporal questions but do not create new independent sites.
Which evaluation is specific?
Dificuldade 1/5 · Moedas 100 + pequeno bônus na primeira conclusão hoje
A useful evaluation links a named cause to a consequence and an operational improvement.
Apply evidence within its scope
- Report raw data, units, exclusions, method, uncertainty and assumptions so another person can evaluate the claim. Compare with suitable published evidence and acknowledge differences in methods or populations.
- A recommendation can weigh ecological evidence, costs, law and values. The survey alone does not establish every policy consequence; propose a further test where uncertainty matters.
What strengthens an environmental recommendation?
Dificuldade 1/5 · Moedas 100 + pequeno bônus na primeira conclusão hoje
Keep the recommendation’s strength proportional to the investigation’s evidence.