Sampling populations without choosing the answer
Introduzido| English | Significado |
|---|---|
| population/ˌpɒpjʊˈleɪʃn/ | População |
| quadrat/ˈkwɒdræt/ | Quadrante |
What would explain this observation?
- A field edge looks richer in plants than its centre. Choosing only the richest patches would build the desired result into the sampling method.
Build the model
- A population 种群 consists of organisms of one species in a defined area.
- Random quadrats 样方 estimate density without deliberately selecting patches.
- A transect investigates change along an environmental gradient.
- quadrat: A defined area used for sampling.
- population: Organisms of one species in a defined area.

Which method investigates change from a path into woodland?
Dificuldade 1/5 · Moedas 100 + pequeno bônus na primeira conclusão hoje
A transect samples at fixed distances along a line, so the change from open path into woodland is recorded systematically. Choosing only large plants or one convenient spot biases the sample and cannot show a gradient.
Match each technical term to its precise meaning.
Dificuldade 2/5 · Moedas 140 + pequeno bônus na primeira conclusão hoje
Use the definitions to distinguish related quantities and processes.
Choose evidence that can test it
- Estimate total abundance by multiplying mean density by area, with consistent units.
- This assumes sampled areas represent the habitat.
- Patchiness and too few samples widen uncertainty.
In the lab: Choose coordinates with random numbers before visiting the patches. Record quadrat area and counting rules. For a transect, use fixed distances and measure a relevant abiotic variable. Do not damage habitats or sample unsafe locations.
Which two habits make the investigation or model in this case more defensible?
Dificuldade 2/5 · Moedas 140 + pequeno bônus na primeira conclusão hoje
Stating the conditions and assumptions lets others repeat the work exactly, and recording the supporting evidence lets them check the conclusion. Hiding disagreeing results removes the evidence that could challenge a wrong conclusion, and one measurement can never establish a wider claim.
Work from known quantities
- Known: five 0.25 square metre quadrats contain 3, 4, 6, 5 and 2 plants.
- Mean count = 20/5 = 4.
- Density = 4/0.25 = 16 plants per square metre.
- Estimated abundance in 100 square metres = 16 × 100 = 1,600 plants.
Your turn: Mean count is 6 in a 0.5 square metre quadrat. Find density per square metre.
The estimate depends on which patches you sample
The lesson counts 3, 4, 6, 5 and 2 give a mean of 4 per 0.25 m²: 16 plants/m² and an estimate of 1,600 in 100 m². Compare new random samples with deliberately crowded patches in a known model habitat.
Mean count is 6 in a 0.5 square metre quadrat. Find density per square metre.
Dificuldade 2/5 · Moedas 140 + pequeno bônus na primeira conclusão hoje
The result is 12 . Known: mean count 6 plants per 0.5 square metre quadrat. Use density = mean count / quadrat area. Density = 6/0.5 = 12 plants per square metre. An abundance estimate scales this density up to the whole area.
Check the conclusion and its limits
- Quadrats suit organisms that do not move quickly.
- A food chain arrow shows the direction of energy transfer, not the direction a predator travels.
Not true: Sampling only the most crowded patches gives an unbiased population estimate. Choosing the most crowded patches overestimates density, because the samples are not representative of the whole area. Unbiased estimation needs random or systematic sampling decided before looking at the plants.
- A population consists of organisms of one species in a defined area.
- Estimate total abundance by multiplying mean density by area, with consistent units.
- Watch for: quadrats suit organisms that do not move quickly.
Sampling only the most crowded patches gives an unbiased population estimate.
Dificuldade 1/5 · Moedas 100 + pequeno bônus na primeira conclusão hoje
Choosing the most crowded patches overestimates density, because the samples are not representative of the whole area. Unbiased estimation needs random or systematic sampling decided before looking at the plants.
A defined area used for sampling: write the technical term.
Dificuldade 1/5 · Moedas 100 + pequeno bônus na primeira conclusão hoje
quadrat means A defined area used for sampling.
Write from a density of 20 plants per square metre
- The mean count is 5 plants in a 0.25 square metre quadrat.
- Find the density per square metre. Sampling only crowded patches overestimates density.
The mean count is 5 plants in a 0.25 square metre quadrat. What is the density per square metre, and what does sampling only crowded patches do?
Density is the mean count divided by the quadrat area. Representative samples are required for an unbiased estimate.
In an invented quadrat survey, the mean is 5 plants per 0.25 square metre quadrat. What is the estimated density per square metre?
Dificuldade 1/5 · Moedas 100 + pequeno bônus na primeira conclusão hoje
5 divided by 0.25 is 20 plants per square metre. The mean count is not yet a density. Other options — 5 plants per square metre (the mean count); 0.25 plants per square metre (the quadrat area).
Test a food-web explanation against alternatives
- Wolves returned to Yellowstone in 1995, creating an opportunity to investigate predator, prey and vegetation links. A trophic cascade is an indirect effect across feeding levels, not a claim that one species determines every ecosystem outcome. Water availability, other predators, hunting, weather and sampling locations can also affect vegetation and prey.
- The National Park Service describes the continuing research. A before-and-after pattern can motivate a hypothesis, but comparison sites, mechanisms and alternative explanations matter for causal inference. The numerical sampling and productivity examples below are invented teaching datasets unless a dated source is explicitly named.
Does a vegetation increase after predator recovery by itself prove the predator alone caused every change?
Dificuldade 1/5 · Moedas 100 + pequeno bônus na primeira conclusão hoje
Temporal association motivates a hypothesis; attribution requires a defensible design and mechanism.
Distinguish the levels of organisation
- A population comprises organisms of one species in a defined place and time. A community includes interacting populations of different species, while an ecosystem includes those communities and their physical surroundings. A habitat is where an organism lives; a niche describes conditions, resources and interactions associated with its way of life. A lake habitat can contain many distinct niches.
- Under the biological species concept, populations can potentially interbreed to produce viable fertile offspring and are reproductively isolated from other such groups. This is a useful concept with limits for fossils, asexual organisms and some hybridising groups. A scientific name combines genus and specific epithet, such as Canis lupus; the genus alone does not identify the species.
Which includes a community and its physical surroundings?
Dificuldade 1/5 · Moedas 100 + pequeno bônus na primeira conclusão hoje
A population concerns one species; an ecosystem combines living communities and their physical environment.
Why should the biological species concept be qualified?
Dificuldade 1/5 · Moedas 100 + pequeno bônus na primeira conclusão hoje
Use a species concept appropriate to the evidence and purpose; one definition does not resolve all groups.
Identify organisms and measure conditions
- A dichotomous key uses paired observable alternatives to identify a specimen. Follow the actual feature, not an expected answer; a damaged or immature specimen may lack the required character. Record uncertain identifications and use suitable images, reference collections or expert checks where needed. Counting an unidentified organism twice as two species inflates apparent richness.
- Abiotic factors include light, temperature, pH, salinity, oxygen and moisture; biotic factors include competitors, food, predators and parasites. Use a calibrated instrument appropriate to each factor, record units, and standardise time, depth and weather where possible. An abundance correlation with temperature does not isolate temperature's effect if moisture or shade changes at the same time.
Interpret a tolerance curve without overclaiming
- A tolerance curve represents performance or abundance across a stated environmental factor. Distinguish the optimum range from stress and conditions beyond tolerance. The curve's shape depends on the organism, life stage, response measured and other conditions; a smooth bell shape is a model, not a universal measured distribution for every species.
- Absence from a sampled location may result from dispersal limits, competition, disturbance or detection failure as well as unsuitable conditions. To infer a tolerance limit, combine field patterns with controlled or repeated evidence. A single abiotic measurement taken after an organism has disappeared may not describe the conditions it experienced during establishment.
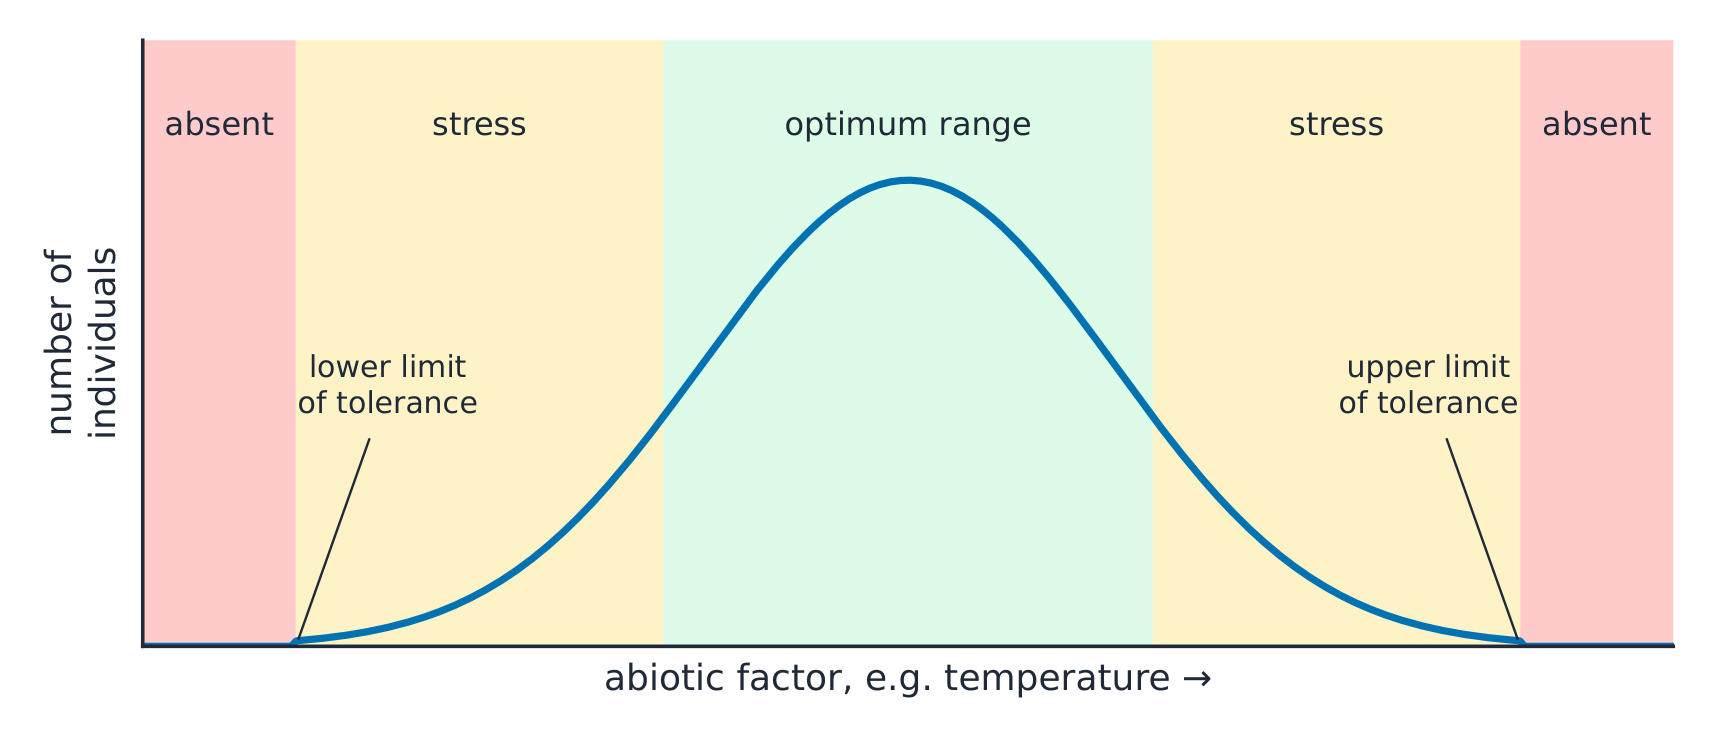
A species is absent from one quadrat. What can be concluded about its tolerance?
Dificuldade 1/5 · Moedas 100 + pequeno bônus na primeira conclusão hoje
Combine representative field observations with other evidence before identifying a tolerance boundary.
Separate an exponential phase from a crash
- In an exponential model with constant positive per-capita net growth, a larger population adds more individuals per interval. Small absolute increases early do not imply a fundamentally different mathematical growth law. A pure exponential curve contains no automatic crash; depletion, changed conditions or delayed regulation must be added to model a boom-and-bust outcome.
- Logistic growth slows as density-dependent constraints increase, approaching a model carrying capacity. Real populations can overshoot, fluctuate, migrate or face a changing carrying capacity. A plateau can reflect a balance among births, deaths, immigration and emigration, not necessarily births equalling deaths in an open population. Interpret the time scale and rates, not only the letter J or S.

Does a pure constant-rate exponential growth equation contain a later resource-driven crash?
Dificuldade 1/5 · Moedas 100 + pequeno bônus na primeira conclusão hoje
An exponential phase and a boom-and-bust model are different descriptions.
Explain population regulation by mechanism
- Density-dependent effects become stronger with crowding under the stated conditions, such as competition for food or transmission of some infections. A density-independent driver, such as an external frost, is not primarily caused by population density; it can still affect different ages or locations unequally. These labels do not guarantee an identical death fraction in every population.
- More prey may support more predators, whose feeding reduces prey; the delayed counteracting loop can produce cycles. Carrying capacity depends on resources and conditions rather than being an unchanging species constant. Human populations also alter technology, trade and consumption, so there is no single easy human carrying-capacity number independent of assumptions about living standards and environmental impacts.
Which statement correctly qualifies carrying capacity?
Dificuldade 1/5 · Moedas 100 + pequeno bônus na primeira conclusão hoje
Resource availability, technology or environmental conditions can alter the sustainable stock or the model parameters.
Connect interactions with community effects
- Competition concerns a shared limiting resource and can occur within or between species. Predation, herbivory and parasitism transfer resources while affecting survival or growth; mutualism provides benefits to both partners under the relevant conditions. An interaction label is a starting description, not proof that its effect is equally strong everywhere or never changes with context.
- A keystone species has a disproportionate effect relative to its abundance. Sea otters can reduce urchin pressure on kelp, and sea-star removal experiments illustrate how predation can affect competing mussels and community diversity. Test the mechanism and context rather than treating a keystone as simply the largest or most numerous species. Habitat protection also needs the conditions and interactions supporting less conspicuous organisms.
Choose a representative sampling design
- Quadrats suit plants and suitable sessile or slow-moving animals. Define quadrat area, eligible habitat and edge-counting rules before sampling. Random coordinates reduce deliberate patch selection, while systematic intervals can reveal a gradient. A random start helps, but periodic habitat structure can still interact with fixed spacing. Stratified sampling separates distinct habitats and weights their estimates by area.
- A transect compares locations along an environmental gradient; record a relevant abiotic factor at each station and use replicates where possible. Sampling only the richest patches biases an abundance estimate upward. More samples from the same biased location do not fix the design. Choose a safe, minimally damaging method and explain any inaccessible areas omitted from the target population.
Why can a systematic sample still be biased?
Dificuldade 1/5 · Moedas 100 + pequeno bônus na primeira conclusão hoje
Representative coverage and design matter; more observations in the same biased layout do not necessarily solve the problem.
Scale a quadrat count with consistent units
- In an invented field, ten random quadrats each cover $0.25\ \mathrm{m^2}$ and contain 46 daisies in total. Mean count is 4.6 per quadrat. Divide by quadrat area to get $18.4\ \dfrac{\mathrm{plants}}{\mathrm{m^2}}$, then multiply by a field area of $2000\ \mathrm{m^2}$ to estimate 36,800 plants. A mean count is not already a density unless the quadrat covers one square metre.
- Twelve $0.5\ \mathrm{m^2}$ quadrats containing 30 thistles give a mean 2.5, density $5\ \dfrac{\mathrm{plants}}{\mathrm{m^2}}$ and an estimate of 3000 in a $600\ \mathrm{m^2}$ field. Patchiness, sample size, identification and counting rules limit confidence. Keep individual counts to describe variation rather than reporting the scaled result as an exact census.
Ten quadrats, each 0.25 m², contain a total of 46 plants. Find estimated density per square metre.
Dificuldade 2/5 · Moedas 140 + pequeno bônus na primeira conclusão hoje
Mean count = 46/10 = 4.6 plants per quadrat. Density = 4.6/0.25 = 18.4 plants/m².
Twelve representative quadrats, each 0.5 m², contain a total of 30 thistles. Estimate abundance in a 600 m² field.
Dificuldade 2/5 · Moedas 140 + pequeno bônus na primeira conclusão hoje
Mean count = 30/12 = 2.5 plants per quadrat. Density = 2.5/0.5 = 5 plants/m². Estimated abundance = 5 × 600 = 3000 plants, assuming representative sampling.
Distinguish density, cover and frequency
- Density counts individuals per area. Percentage cover estimates the area occupied by a species, useful when individuals are hard to separate. Frequency is the percentage of sampled quadrats in which it occurs. A species can be frequent but have low cover, or dense in a few patches but absent elsewhere. State which measure the question uses before comparing sites.
- In an invented set of ten quadrats, a species appearing in seven has 70% frequency, regardless of whether those seven contain one or many individuals. Cover estimates need a consistent visual or point-intercept rule. Use the same quadrat size, season and effort when comparing; changing the method can imitate an ecological trend.
A species occurs in seven of ten quadrats. Find its percentage frequency.
Dificuldade 2/5 · Moedas 140 + pequeno bônus na primeira conclusão hoje
Percentage frequency = occupied quadrats/total sampled quadrats × 100 = 7/10 × 100 = 70%. A quadrat contributes one presence whether it contains one plant or several. Counting total plants would instead be part of an abundance or density calculation, not this frequency measure.
Estimate mobile animals and test the assumptions
- In capture–mark–release–recapture, let M be initially marked animals, C the later catch and R the marked animals in that catch. The simple estimate is $N=MC/R$. For invented M = 40, C = 50 and R = 8, the estimate is 250. The marked fraction in the recapture is used to infer the marked fraction of the population.
- Marks should persist, marked animals should mix, capture probability should be suitable, and major births, deaths and migration should be negligible over the interval. Lost marks can make R too low and the estimate too high; trap-happy marked animals can make R too high and the estimate too low. With no recaptures, do not report a finite estimate by dividing by zero. Sampling uncertainty remains even with a reasonable design.
With M = 60 marked, C = 45 recaptured total and R = 9 marked in the recapture, estimate N using MC/R.
Dificuldade 2/5 · Moedas 140 + pequeno bônus na primeira conclusão hoje
60 × 45/9 = 300, conditional on suitable mixing, closure and capture/mark assumptions.
If marks are lost before recapture, what bias can result in the simple Lincoln estimate?
Dificuldade 1/5 · Moedas 100 + pequeno bônus na primeira conclusão hoje
Record the mechanism: mark loss changes the observed marked fraction.
Compare richness and evenness explicitly
- Species richness counts species; diversity also depends on their relative abundance. For the specified Simpson reciprocal formula, $D=N(N-1)/\sum n(n-1)$, the invented counts 10, 6 and 4 give N = 20 and denominator 132, so D is about 2.88. Counts 18, 1 and 1 have the same richness but denominator 306 and D about 1.24, reflecting lower evenness.
- State the formula because other indices also carry Simpson's name. A zero denominator or fewer than two sampled individuals requires special treatment rather than blind division. Differences can reflect sampling, habitat and season as well as disturbance. A lower value is not unique proof of pollution; compare like samples and consider abundance, identity and ecological function alongside the index.
Counts are 12, 5 and 3. Use D = N(N−1)/Σn(n−1). Find D.
Dificuldade 2/5 · Moedas 140 + pequeno bônus na primeira conclusão hoje
Total N = 12 + 5 + 3 = 20. Sum n(n−1) = 12×11 + 5×4 + 3×2 = 132 + 20 + 6 = 158. Thus D = 20×19/158 = 380/158 = 2.40506, or 2.4 to two significant figures. Do not substitute a different Simpson formula.
Trace carbon and energy through a food web
- Producers build organic compounds from inorganic carbon using an external energy source. Consumers obtain organic compounds from other organisms; decomposers process dead matter and wastes, returning nutrients to the environment. Photosynthesis stores energy in chemical form, while respiration transfers energy for biological processes and disperses some as heat. All living groups respire, including plants.
- A food-chain arrow points from food toward the organism receiving its matter and energy, for example grass → rabbit → fox. An omnivore can feed at more than one trophic level, and detrital pathways connect many parts of the web. A food web is therefore a network of routes rather than one fixed ladder assigned permanently to every species.
In grass → rabbit → fox, what do the arrows indicate?
Dificuldade 1/5 · Moedas 100 + pequeno bônus na primeira conclusão hoje
Food-web arrows follow the transfer; energy is transformed and conserved, not created by feeding.
Explain why higher trophic levels have less available production
- Not all lower-level biomass is eaten or assimilated, and respiration disperses energy as heat. Uneaten material and wastes can support decomposers rather than vanish. Energy is conserved, while less is available in new biomass at higher trophic levels. Material atoms can cycle through the ecosystem; usable energy needs continuing input and is not recycled indefinitely in the same form.
- The assigned pyramid uses 10% steps for illustration, not a fixed natural rule or a true average of all ecosystems. Transfer efficiencies and food-chain lengths vary. Eating at a lower trophic level can reduce energy-transfer losses for a given production chain, but a complete sustainability comparison also considers land, water, nutrients, distribution and the production method.
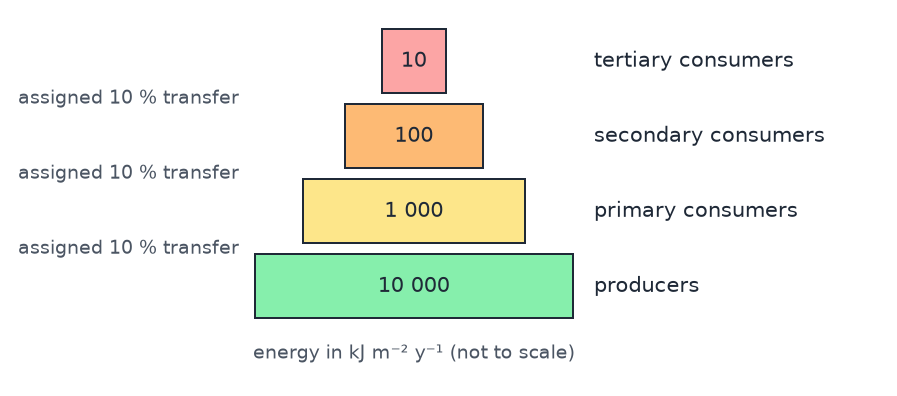
Which qualification is needed for a ten-percent trophic diagram?
Dificuldade 1/5 · Moedas 100 + pequeno bônus na primeira conclusão hoje
Keep a model’s chosen numbers separate from general ecological evidence.
Read ecological pyramids with their time basis
- A pyramid of numbers counts organisms, so one large tree can support many small consumers. A standing-biomass pyramid measures mass at a time and can be inverted where fast-turnover producers maintain a small standing stock while supporting consumers. A productivity pyramid measures energy flow per area per time, so compare matching periods, boundaries and feeding pathways.
- Dry mass removes much of the water that otherwise makes comparisons misleading. Obtain only approved plant samples, dry to constant mass under supervision, record area and sampling assumptions, and avoid unnecessary habitat damage. Energy estimates from combustion also need a defined method and corrections for losses. A stock in grams per area cannot be substituted directly for a flow in energy per area per year.
Why can a standing-biomass pyramid be inverted in an aquatic ecosystem?
Dificuldade 1/5 · Moedas 100 + pequeno bônus na primeira conclusão hoje
A snapshot stock differs from a flow over time; compare a consistent accounting basis.
Separate accumulation from biomagnification
- Bioaccumulation concerns increasing body burden over time when uptake exceeds elimination; biomagnification concerns higher concentrations across feeding levels. Chemical persistence, uptake, elimination and diet all matter. DDT-related compounds can be fat-associated, but EPA describes methylmercury binding to proteins in fish muscle. Not all pollutants are stored in fat or retained completely forever.
- An invented gradient gives water .00005 ppm, plankton .04, fish 1 and a bird 25 ppm on stated comparable analytical bases: the bird/water ratio is 500,000. These are teaching numbers, not claimed observations from a named marsh. Tissue, chemical form and wet/dry basis must be checked before comparing. Microplastics can be ingested and carry chemicals, but ingestion alone does not prove biomagnification or the same effect in every organism.
An invented bird concentration is 25 ppm and water concentration .00005 ppm on comparable analytical bases. Find the ratio.
Dificuldade 2/5 · Moedas 140 + pequeno bônus na primeira conclusão hoje
25/.00005 = 500000. These numbers illustrate a ratio, not measured evidence from a named historical study.
Which correction is needed to “all biomagnifying pollutants are stored in fat”?
Dificuldade 1/5 · Moedas 100 + pequeno bônus na primeira conclusão hoje
Chemical persistence and binding vary; do not apply DDT’s fat association to every substance.
Distinguish a carbon store from a net sink
- A carbon store is an amount, while a flux is a rate between stores. A sink takes up more carbon than it releases over a stated interval; a source releases more than it takes up. A large forest or ocean store is not necessarily a net sink at every time. State whether numbers represent carbon mass or carbon-dioxide mass; converting from carbon to CO₂ multiplies by 44/12.
- Photosynthesis, respiration, feeding, decomposition, combustion and ocean exchange connect stores. Large opposing natural fluxes can nearly cancel; a smaller net imbalance can still increase atmospheric carbon. Use a dated dataset and consistent units for numerical budgets, and do not combine plant respiration with an estimate that already includes total ecosystem respiration.

How many tonnes of CO₂ contain 12 tonnes of carbon, using atomic mass ratio 44/12?
Dificuldade 2/5 · Moedas 140 + pequeno bônus na primeira conclusão hoje
CO₂ mass = carbon mass × 44/12 = 12 × 44/12 = 44 tonnes CO₂. Carbon and carbon-dioxide mass units differ; use 44/12, not 12/44.
Interpret human carbon-cycle effects with dates and units
- Fossil-fuel combustion, cement production and land-use change alter carbon flows; oceans and land take up part of the additional carbon. NOAA's global annual mean was 422.8 ppm in 2024, compared with about 280 ppm before industrialisation. A global annual mean is different from one site's monthly seasonal peak, and the year should remain attached to the number.
- Dissolved CO₂ can lower ocean pH and carbonate availability. A model pH change from 8.2 to 8.1 corresponds to a hydrogen-ion activity ratio of $10^{0.1}\approx1.259$, about 26% higher for those rounded values. The ocean remains alkaline overall; acidification means a shift toward lower pH, not necessarily crossing below 7. Effects depend on organism and conditions rather than one identical response by every shell-building species.
For a pH decrease from 8.2 to 8.1, find the percentage increase in hydrogen-ion activity from 100(10^.1 − 1).
Dificuldade 2/5 · Moedas 140 + pequeno bônus na primeira conclusão hoje
Since pH = −log₁₀(aH⁺), the hydrogen-ion activity ratio is a₂/a₁ = 10^(8.2 − 8.1) = 10^0.1 = 1.258925… . Relative increase = 100 × (a₂/a₁ − 1) = 25.8925…%, about 25.9%. The 0.1 is a change in pH, not a 0.1% activity increase. For these rounded pH values, the water remains alkaline overall.
Connect latitude with atmospheric circulation
- Solar energy arrives more directly near the equator than at high latitudes. In the simplified tricellular model, rising warm moist air near the equator cools and can form rain; descending subtropical air warms and has lower relative humidity. Hadley, Ferrel and polar cells describe broad circulation patterns rather than three stationary boxes of identical air.
- These patterns help explain wet equatorial regions and many dry subtropical regions, while seasons shift convergence zones and local conditions modify outcomes. Not every equatorial location has identical year-round rainfall and not every desert lies at 30 degrees. Ocean heat transport, altitude, mountains, continentality and land use also affect observed climates.

Read a biome envelope without treating it as a map
- A biome groups broadly similar ecosystems and their climatic setting. Temperature and precipitation influence water availability and growing conditions, but annual means conceal seasonality and extremes. In the schematic envelope, cold tundra, boreal forest, temperate grassland/forest, dry desert and wet tropical forest occupy broad regions; boundaries are not exact classification lines for every site.
- Tropical forests often have high productivity and diversity, while deserts and tundra face strong water or temperature limits. Maritime and continental temperate systems differ, and freshwater and marine biomes also have depth, salinity, light and nutrient constraints. Shifting climate can move suitable conditions poleward or uphill, but species' dispersal, soils and human barriers determine whether actual communities track them.

Distinguish zonation from change through time
- Zonation describes community differences across space, such as a rocky-shore tidal gradient or vegetation changing with altitude. A transect can record abundance or cover alongside abiotic measurements at fixed stations. A kite diagram places width proportional to a stated abundance measure along the transect, allowing distributions to be compared without pretending the widths are habitat boundaries.
- Succession concerns change over time at a site. A sequence of locations of different apparent ages can suggest a trajectory, but a space-for-time substitution assumes their histories and conditions are otherwise comparable. Repeated observations, dated records or suitable pollen evidence can test temporal change more directly. A spatial transect alone cannot prove that each station is a successive historical stage of the others.
Does a transect across sites prove that those sites were successive stages through time?
Dificuldade 1/5 · Moedas 100 + pequeno bônus na primeira conclusão hoje
Zonation concerns space, succession concerns time. Comparable site history cannot simply be assumed.
Explain several possible succession pathways
- Primary succession starts on a newly available substrate without developed soil; secondary succession follows disturbance where soil or biological legacies remain. Colonists can change organic matter, water retention, nutrient cycling and competition. Existing roots or seed banks can speed recovery, but intensity, repeated disturbance and arrival of organisms alter the route.
- A classical bare-rock sequence can proceed from pioneer colonists through grasses, shrubs and trees where conditions permit. Early colonists often mature rapidly with many offspring (r-associated traits); established communities can favour longevity and competition (K-associated traits), with overlap. The Vera wood-pasture hypothesis proposes herbivore-maintained mosaics, challenging an inevitable closed-forest endpoint. Grazing, cutting or burning can maintain a plagioclimax; if intervention stops, subsequent change depends on climate, soils, propagules and disturbance rather than a universal endpoint.
Keep primary production separate from ecosystem carbon balance
- The succession illustration uses relative trajectories, not measured centuries or a guaranteed diversity maximum. Biomass and soil development can increase, while disturbance and competition alter the pattern. A mature community can maintain substantial photosynthesis and net primary production that supports consumers and decomposers even when its total carbon store changes little.
- NPP subtracts producer respiration from gross primary production. Net ecosystem production additionally accounts for the rest of ecosystem respiration; a near-balanced total carbon budget can therefore have NEP near zero while NPP remains positive. Confusing these quantities would imply that mature forests provide almost no new producer biomass, which does not follow from steady storage.

If total ecosystem respiration approximately balances GPP, must NPP also be nearly zero?
Dificuldade 1/5 · Moedas 100 + pequeno bônus na primeira conclusão hoje
Near-zero NEP concerns the wider ecosystem carbon balance, not automatically producer net production.
Evaluate ecological evidence as a connected argument
- Begin with a defined question, species identification, boundary, interval and sampling design. Preserve individual observations, uncertainties and unusual conditions. Combine density, community composition, abiotic measurements and evidence about interactions; one diversity index, curve or correlation rarely isolates the cause of an ecological change.
- Judge management options using ecosystem functions, recovery times, distributional effects and model uncertainty. A harvest compatible with one simple growth estimate does not prove that every food-web requirement or habitat condition is protected. Explain which findings support a conclusion, which alternatives remain, and what monitoring could reveal failure before the chosen action causes larger harm.
Evaluate evidence that a changed community reflects a management intervention, using sampling, interactions, energy and temporal change.
Link evidence and mechanism to a bounded conclusion; do not use one index or diagram as universal proof.