| Enduring Understanding | Learning Objective | Essential Knowledge |
|---|---|---|
SPS-7 | SPS-7.A |
|
Industrial and Economic Development Patterns and Processes
AP Human Geography · Topic 7
 8:02
8:02
Industrial and Economic Development Patterns and Processes
Almost everything in the room around you was made in a factory and carried here on a ship. Two hundred and fifty years ago, almost nobody lived like this. Then…
English narration · English + 中文 subtitles burned in
7.1
The Industrial Revolution
Syllabus
Source: College Board AP Course and Exam Description
The Industrial Revolution 工业革命 expanded machine production and factory organisation, first in Britain from the eighteenth century and then unevenly elsewhere. Coal, iron, investment, technology, workers and transport helped industry cluster. New production and transport could support greater food supplies, population growth and urban employment, while changing class relations. Investors also sought resources and markets abroad, contributing to colonial and imperial expansion; technology was not the sole cause.
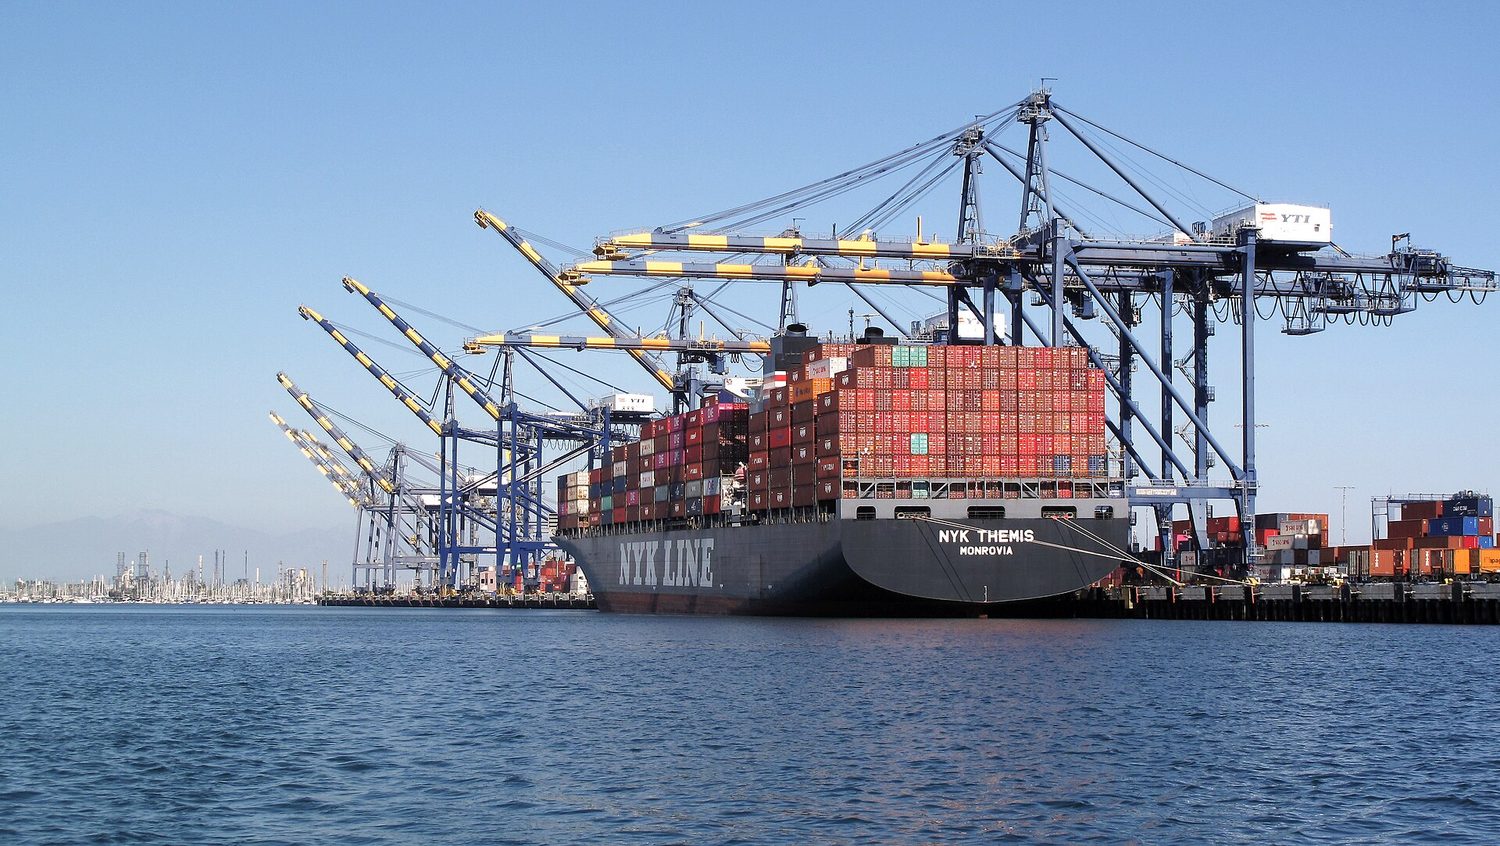
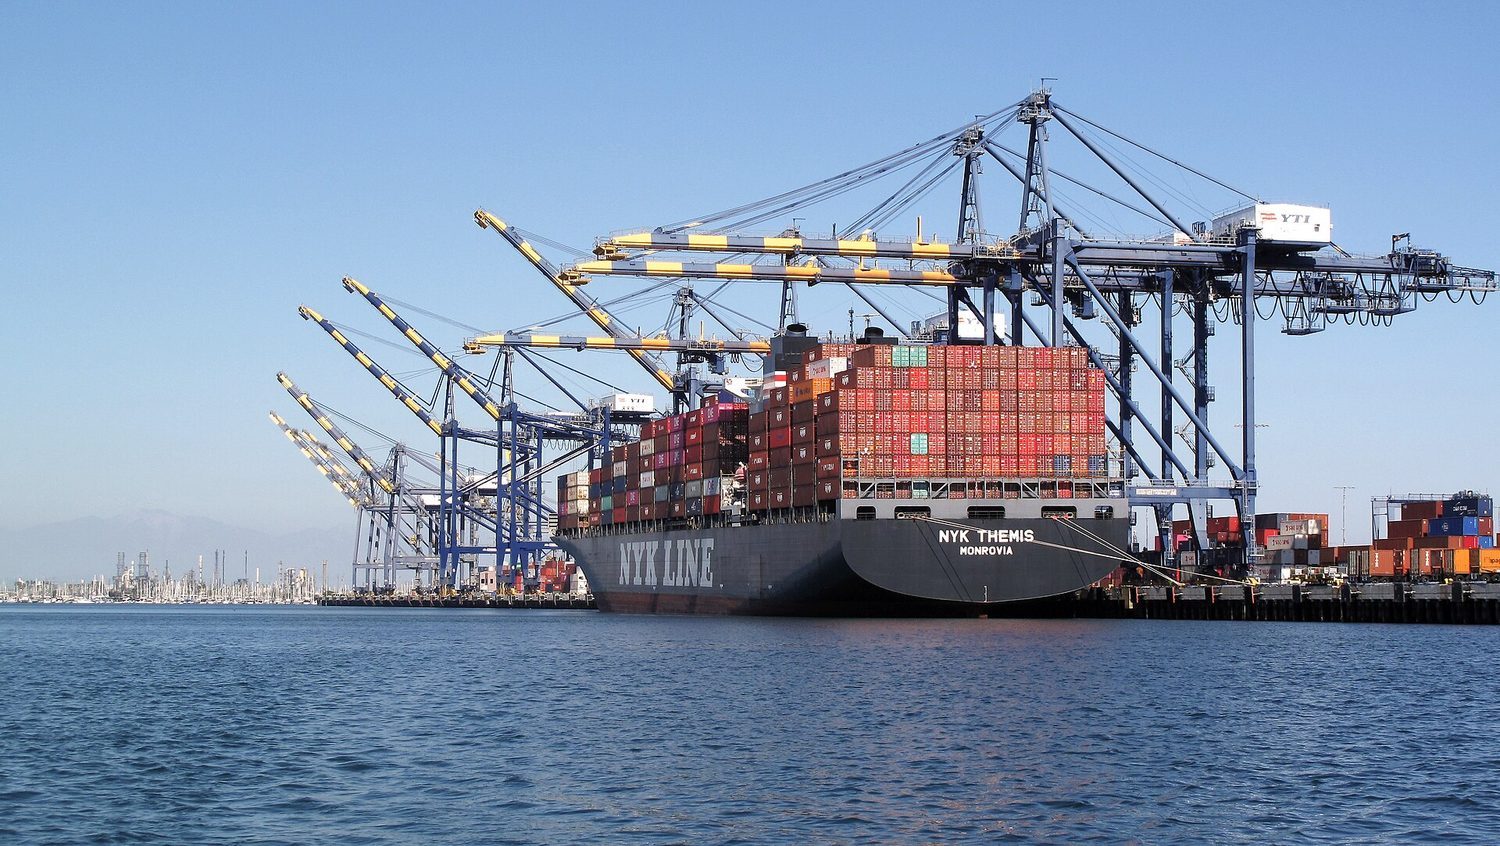
Break-of-bulk points 转运点 are places where cargo changes transport mode, such as a port connecting ships and rail. Handling adds costs, while good connections can attract industry. A photograph of containers shows infrastructure, not the value of trade or local wages.
Vocabulary
Train
| English |
|---|
| Industrial Revolution/ɪnˈdʌstrɪəl ˌrevəˈluːʃn/ |
| Break-of-bulk points/breɪk ɒv bʌlk pɔɪnts/ |
7.2
Economic Sectors and Patterns
Syllabus
| Enduring Understanding | Learning Objective | Essential Knowledge |
|---|---|---|
SPS-7 | SPS-7.B |
|
Source: College Board AP Course and Exam Description
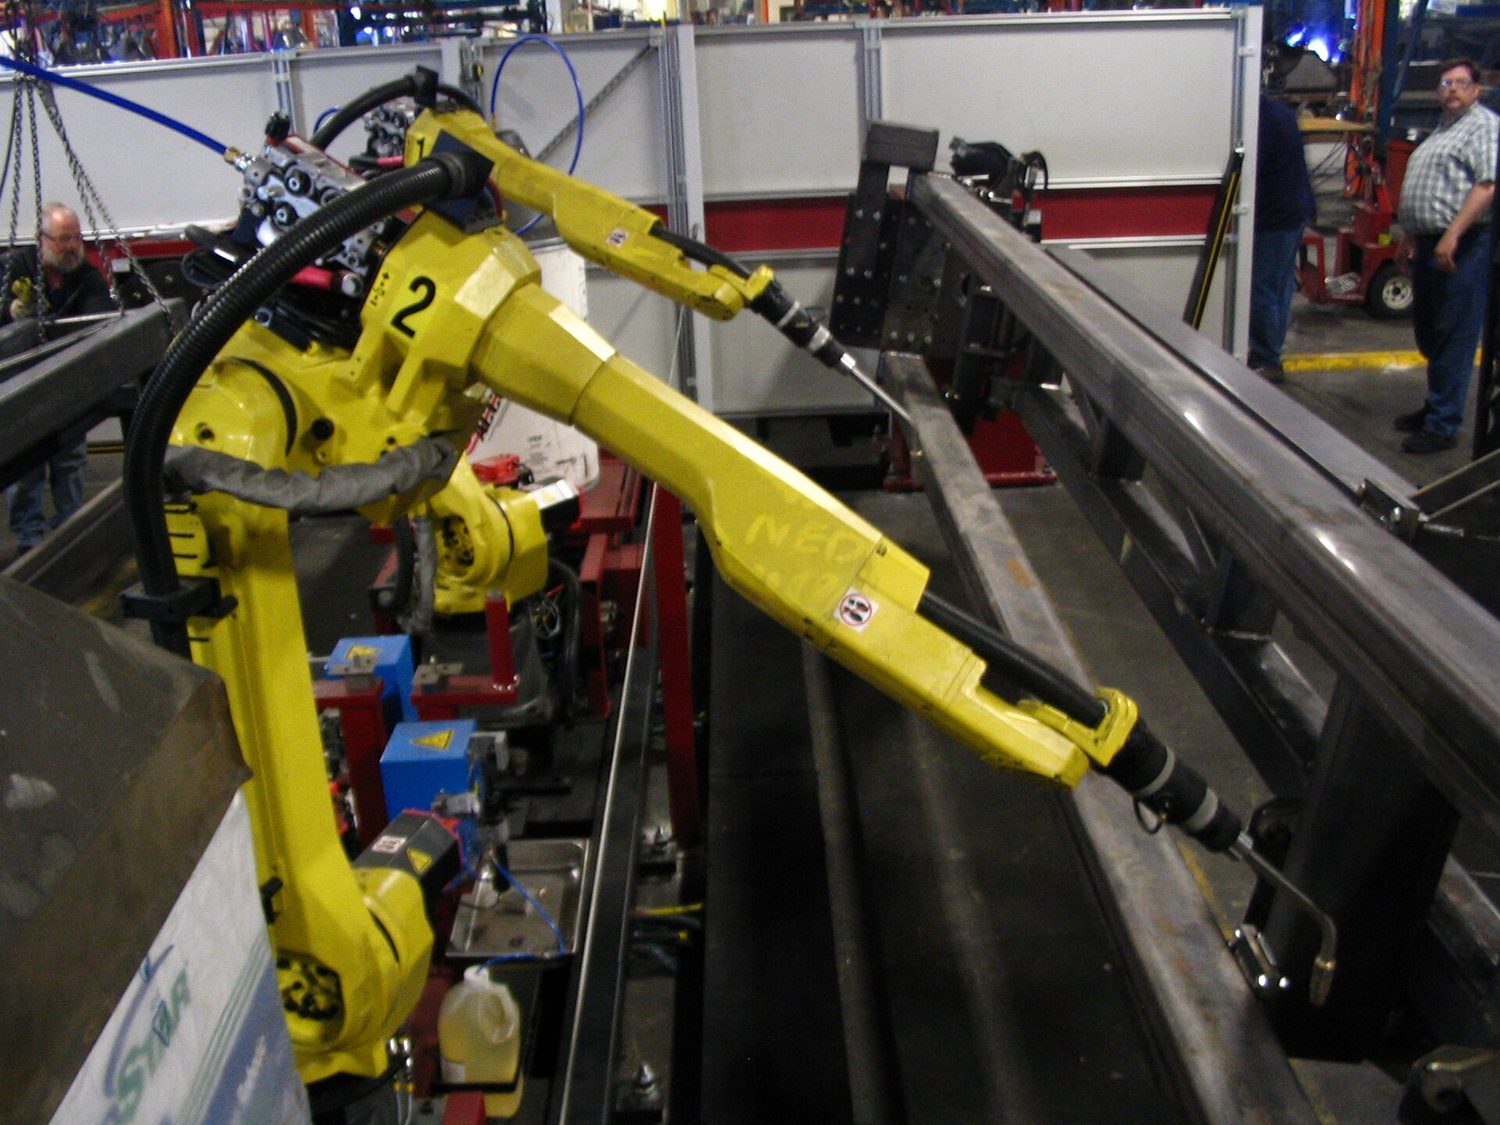
The Primary sector 第一产业 obtains raw materials, including farming, fishing and mining. The Secondary sector 第二产业 manufactures goods. The Tertiary sector 第三产业 provides services. Quaternary 第四产业 activities involve information and research; quinary 第五产业 activities involve high-level decisions. The last two are often treated as specialised services: do not count them twice when using a dataset's categories. Classification follows the activity, not the employer's name: a factory's research scientist does different work from its assembly operator.
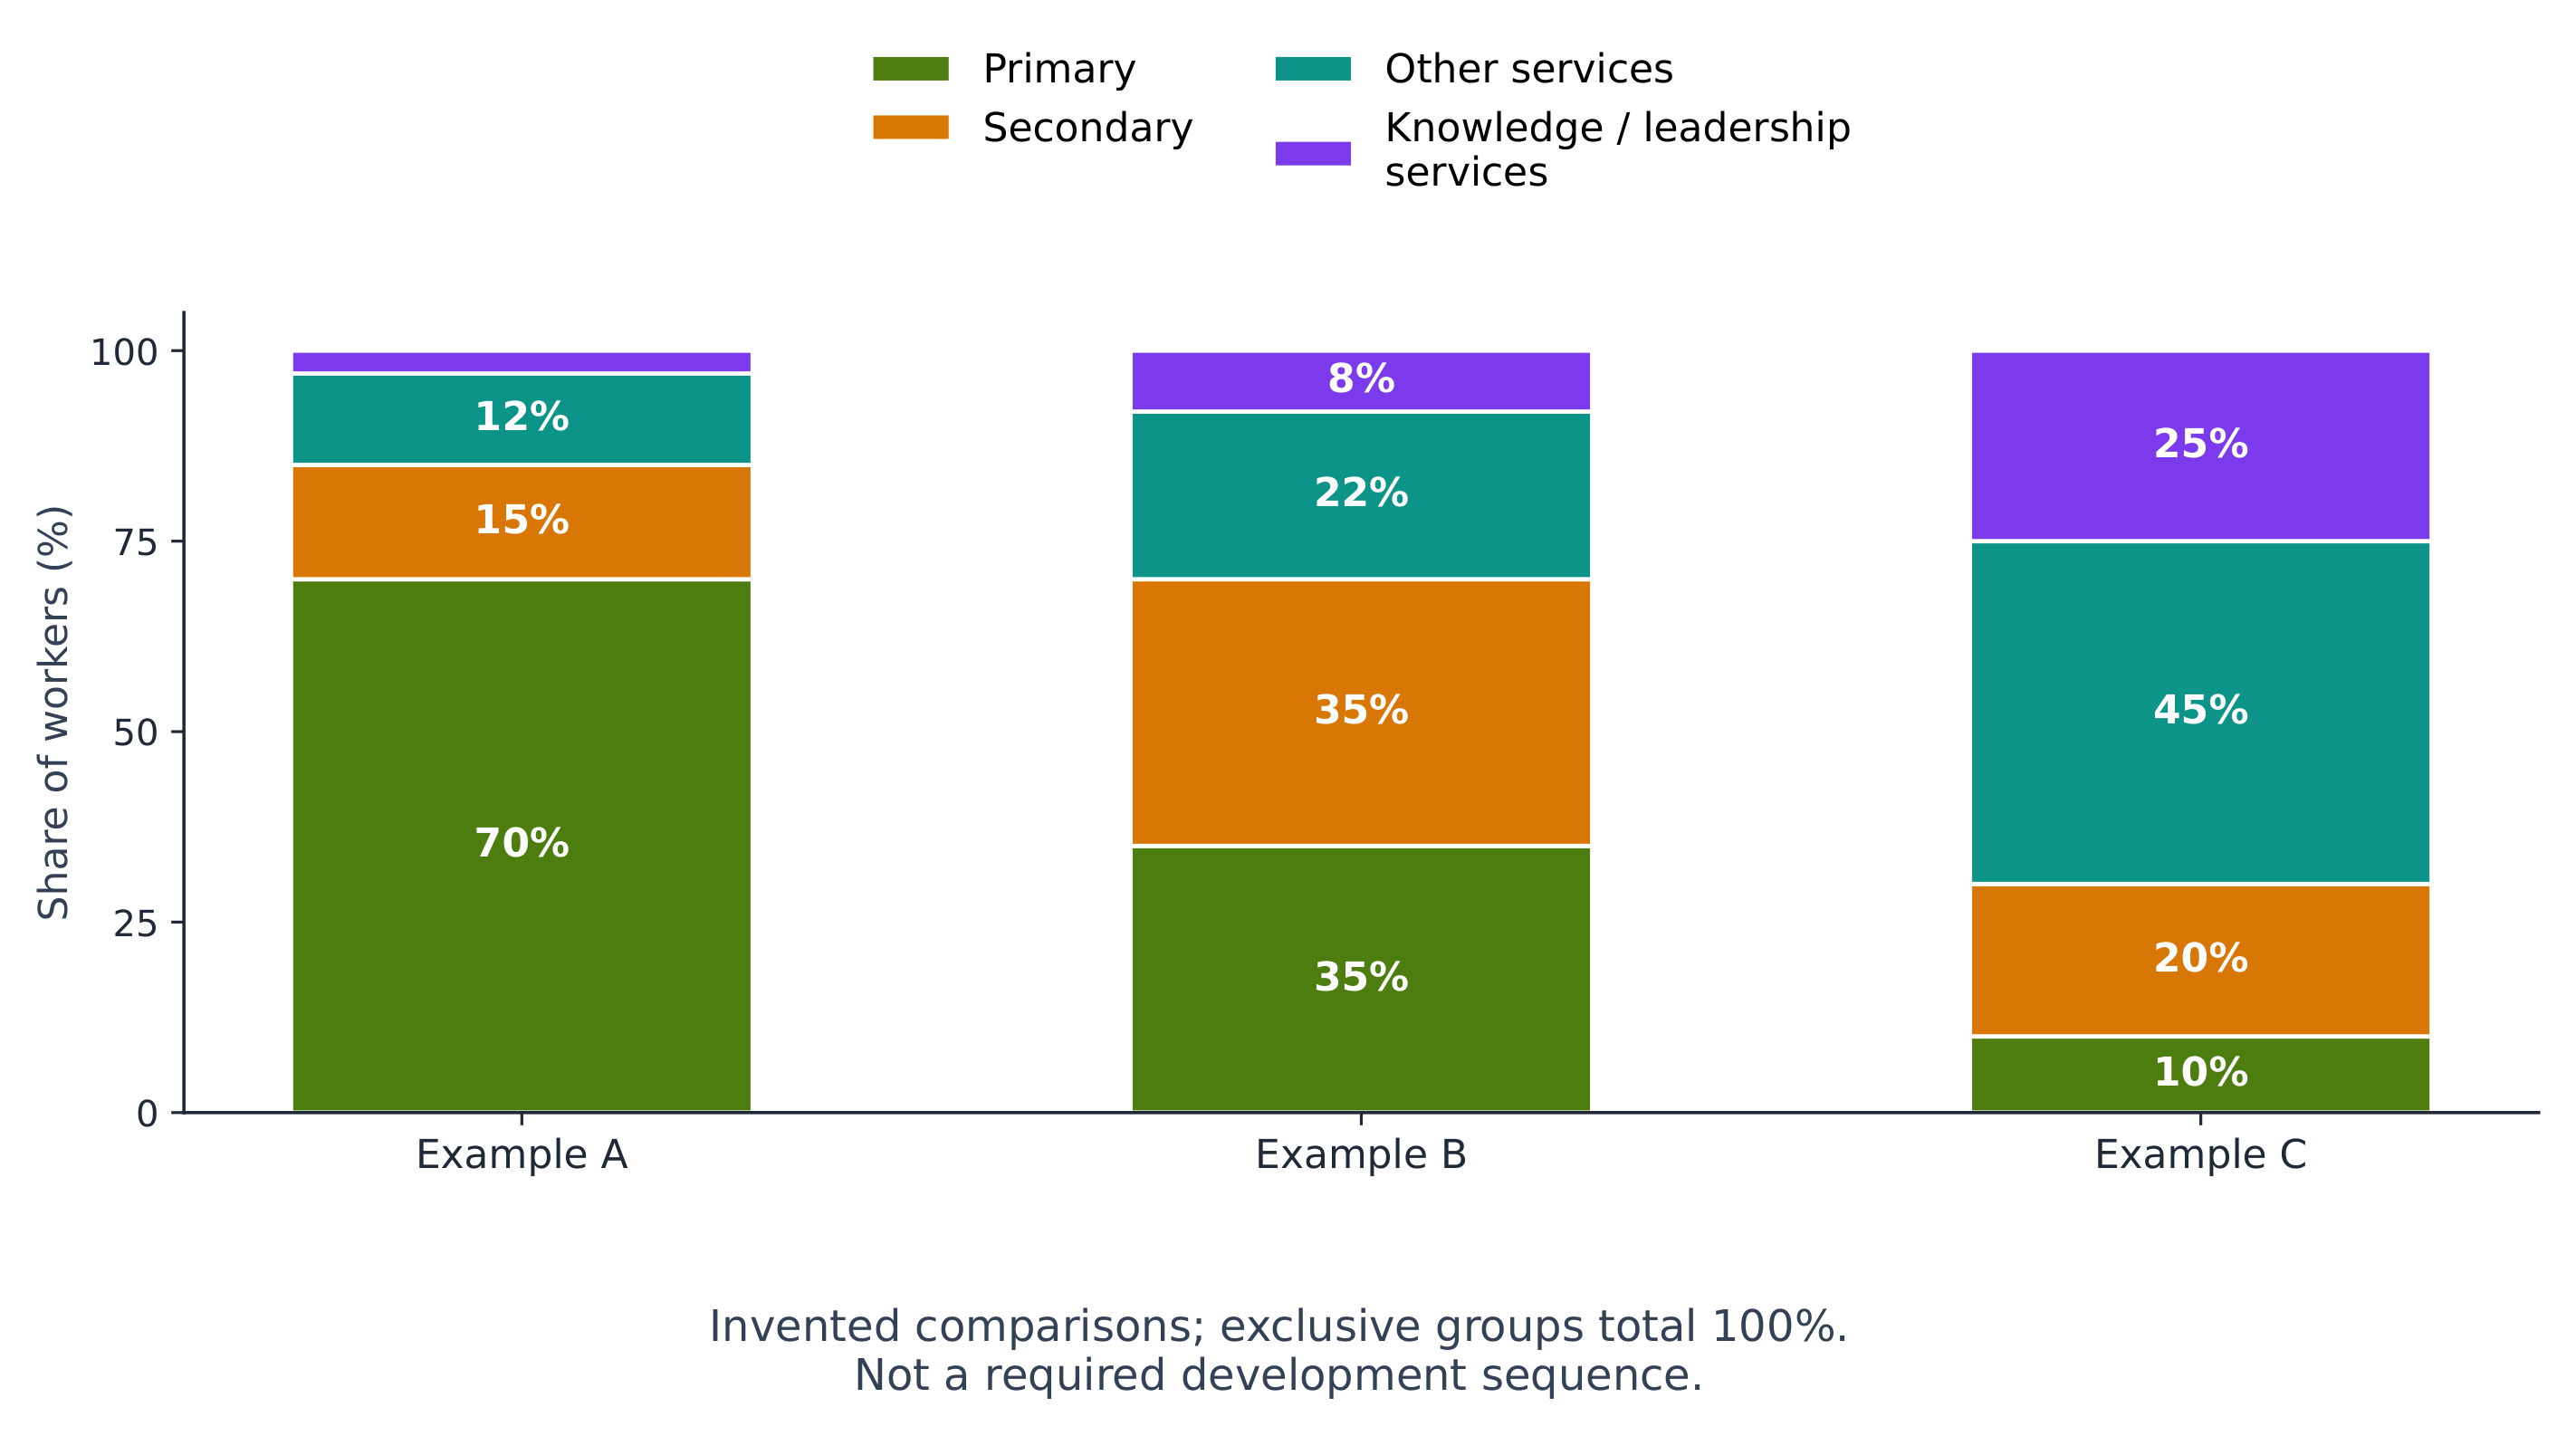
In many historical settings, agricultural productivity and industrialisation reduced agriculture's employment share while manufacturing and services expanded. Service jobs also exist in lower-income economies; a large service share alone does not establish high wages, good health or equality. A share can fall while the number of workers rises, if total employment grows faster.
Original sector task. Economy A has 1,000 workers: 700 primary, 150 secondary, 120 other services and 30 knowledge/leadership services. Economy B has 1,000 workers: 350, 350, 220 and 80 in the same four exclusive groups. The share formula is $s=(n/N)\times100$. A's primary share is $s=(700/1000)\times100=70\%$; B's is $s=(350/1000)\times100=35\%$. B has a lower primary share, but these data do not establish which economy has higher life expectancy or whether A later becomes B.
Weber's least-cost theory 韦伯最小成本理论 explains industrial location through transport and labour costs and the savings from agglomeration. Agglomeration 集聚 is clustering that can support shared suppliers, workers and infrastructure; congestion and higher land costs can offset savings. Bulk-reducing production can favour raw-material locations, whereas bulk-gaining production can favour markets. Weight alone does not settle every case: transport rates, labour, infrastructure and other costs matter.
Original location task. Two sites have the following invented daily costs, all in dollars. R has transport 90, labour 70 and clustering savings 10. M has transport 50, labour 110 and savings 20. Other costs are equal. Use $C=T+L-S$: $C_R=90+70-10=150$ dollars/day and $C_M=50+110-20=140$ dollars/day. M is cheaper in this comparison. If its labour cost rises to 130, $C_M=50+130-20=160$ dollars/day, so R becomes cheaper. The cheapest transport location need not have the lowest total cost.
Exam connection — 2025 AP Human Geography, Set 1, Q1(D). This real question asks how deindustrialisation has affected core-country economies. One possible explanation is that factory closures reduce manufacturing employment and local spending, contributing to unemployment or economic decline. The official scheme also accepts sector shifts and other effects. Explain the requested connection; there is no compulsory universal two-clause formula or guarantee that displaced workers immediately enter better-paid service jobs.
Explore
Which economic sector?
The primary sector extracts raw materials; the secondary sector manufactures goods; the tertiary sector provides services; the quaternary sector handles information and research.
Vocabulary
Train
| English |
|---|
| Primary sector/ˈpraɪməri ˈsektə/ |
| Secondary sector/ˈsekəndəri ˈsektə/ |
| Tertiary sector/ˈtɜːʃjəri ˈsektə/ |
| Quaternary/kwəˈtɜːnəri/ |
| Weber's least-cost theory/ˈwebəz liːst kɒst ˈθɪəri/ |
| quinary/ˈkwɪnəri/ |
| Agglomeration/əˌɡlɒməˈreɪʃn/ |
7.3
Measures of Development
Syllabus
| Enduring Understanding | Learning Objective | Essential Knowledge |
|---|---|---|
SPS-7 | SPS-7.C |
|
Source: College Board AP Course and Exam Description
Development 发展 concerns improvements in economic and social well-being. Choose measures that answer the question rather than ranking one indicator as always best.
- Gross Domestic Product (GDP) per capita 人均国内生产总值 divides production within a territory by its population. It is an average, not each person's income. Gross National Income (GNI) 国民总收入 concerns income accruing to residents, including net primary income from abroad; GNP is a related older national-product measure. Use consistent years, currency and price adjustments when comparing places.
- The Human Development Index (HDI) 人类发展指数 combines life expectancy, education and GNI per capita. Education includes mean schooling for adults and expected schooling for children. HDI is not GDP plus two raw numbers, and the three dimensions are not simply added. It summarises average achievement and does not capture every inequality or environmental cost.
- The Gender Inequality Index (GII) 性别不平等指数 covers reproductive health, empowerment and labour-market participation. Lower values indicate less inequality in the measured dimensions; it is not a wage-gap-only measure.
- The Gini coefficient 基尼系数 measures distributional inequality, often reported on 0–1 or 0–100 scales. Check income versus wealth, definitions and scale before comparing. GDP, HDI and Gini answer different questions.
Literacy, infant mortality, fertility, healthcare access, energy use and employment composition provide further evidence. The informal economy 非正规经济 includes activity outside or insufficiently covered by formal arrangements; it is not necessarily criminal or wholly absent from national estimates.
Original indicator task. Two fictional countries have GDP per capita of 20,000 dollars. X has life expectancy 79 years and mean adult schooling 12 years; Y has 61 and 6. They differ in these social outcomes despite equal GDP per capita. An exact HDI comparison needs GNI, expected schooling and the index method; equal GDP does not establish equal HDI income inputs. Regional and household data are also needed to examine distribution.
Original average task. Four households receive annual incomes of 10, 10, 10 and 70 thousand dollars; four others receive 25 each. Both groups average 25 thousand dollars per household. Equal averages do not establish equal distribution. These household averages are not GDP per capita.
Vocabulary
Train
| English |
|---|
| Development/dɪˈveləpmənt/ |
| Gross Domestic Product (GDP) per capita/ɡrəʊs dəˈmestɪk ˈprɒdʌkt pɜː ˈkæpɪtə/ |
| Human Development Index (HDI)/ˈhjuːmən dɪˈveləpmənt ˈɪndeks/ |
| Gender Inequality Index (GII)/ˈdʒendə ɪniːˈkwɒlɪti ˈɪndeks/ |
| Gini coefficient/ˈdʒiːni ˌkəʊɪˈfɪʃənt/ |
| informal economy/ɪnˈfɔːml ɪˈkɒnəmi/ |
| Gross National Income (GNI)/ɡrəʊs ˈnæʃənl ˈɪŋkʌm/ |
7.4
Women and Economic Development
Syllabus
| Enduring Understanding | Learning Objective | Essential Knowledge |
|---|---|---|
SPS-7 | SPS-7.D |
|
Source: College Board AP Course and Exam Description
Education, paid work and entrepreneurship can expand women's income and choices. Barriers involving care responsibilities, transport, discrimination, land and credit can persist as economies grow. Employment participation does not itself establish equal pay, job security or power. Fertility patterns also involve healthcare, preferences and institutions; do not predict one outcome for every woman from paid work alone.
Microfinance 小额信贷 provides small-scale financial services, including loans that can help establish businesses. Outcomes depend on demand, costs, interest, repayment and control over earnings; borrowing can also create debt pressure. The course recognises opportunities created by microloans without requiring a claim that every borrower benefits.
Original loan task. A small enterprise earns 180 dollars in weekly sales, pays 100 for inputs and other operating costs, and owes a 50-dollar weekly loan payment. Cash left after these stated outflows is $B=S-C-P=180-100-50=30$ dollars. If sales fall to 140, $B=140-100-50=-10$ dollars. This is a simplified cash-flow comparison, not full profit accounting or proof of an effect on gender equality. Investigate who controls the cash and how shortfalls are met.
Vocabulary
Train
| English |
|---|
| Microfinance/ˌmaɪkrəʊfaɪˈnæns/ |
7.5
Theories of Development
Syllabus
| Enduring Understanding | Learning Objective | Essential Knowledge |
|---|---|---|
SPS-7 | SPS-7.E |
|
Source: College Board AP Course and Exam Description
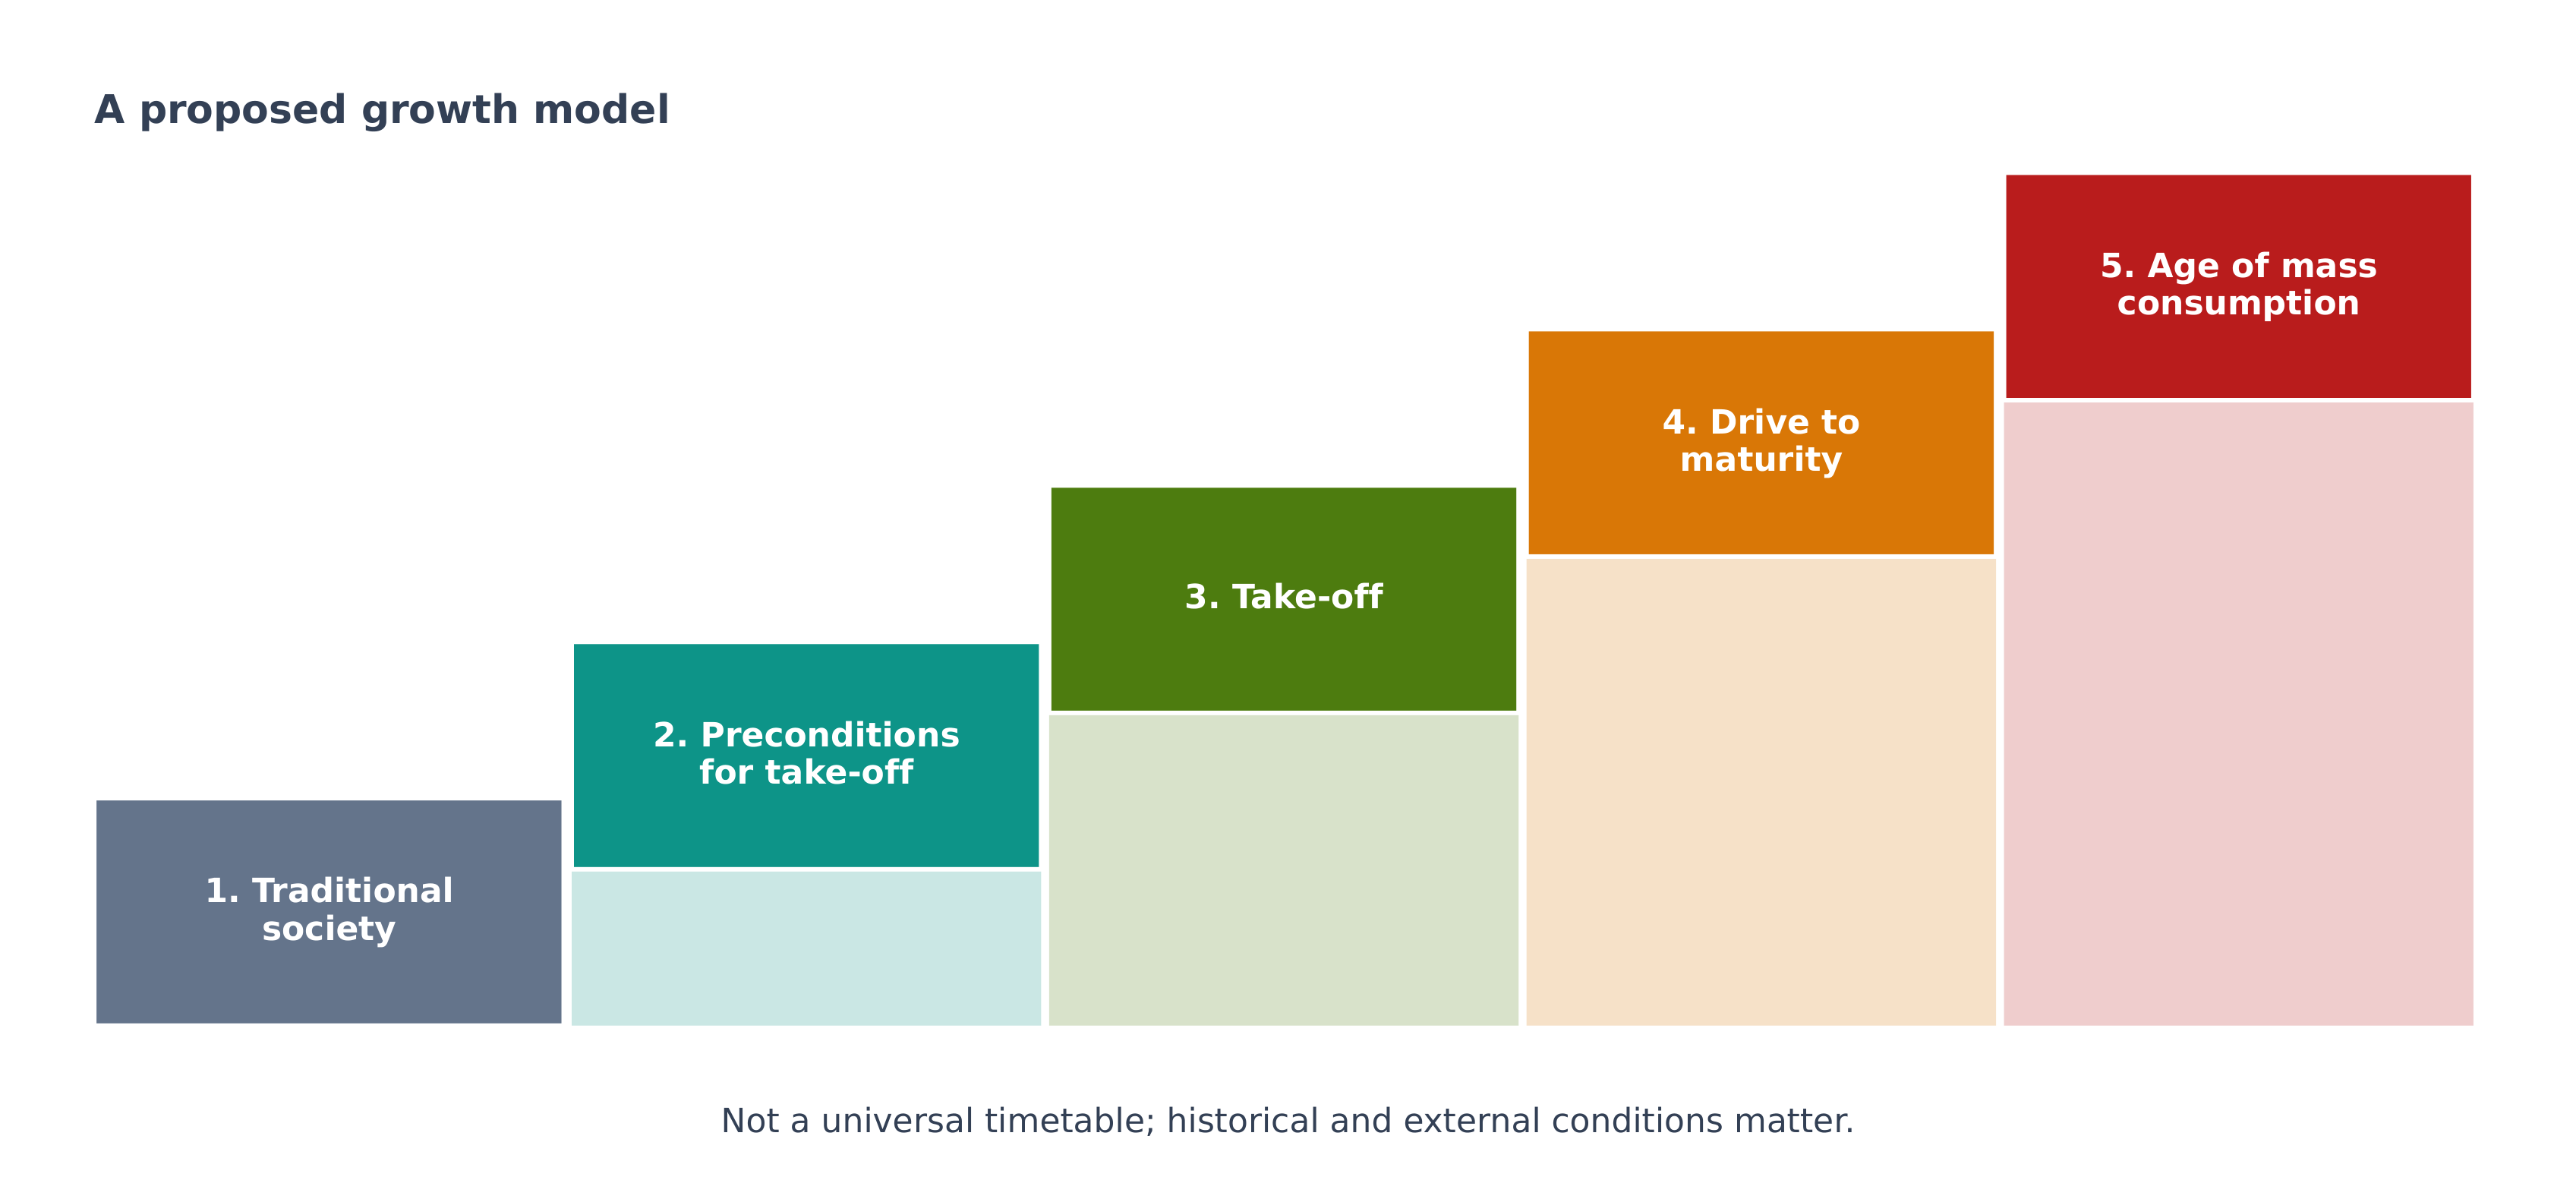
Rostow's stages of growth 罗斯托发展阶段 propose traditional society, preconditions for take-off, take-off, drive to maturity and mass consumption. The model emphasises investment, industrialisation and internal change. It does not prove that every country follows one sequence or that mass consumption is environmentally sustainable. Its historical and external-dependence limitations matter when applying it.
Wallerstein's world-systems theory 沃勒斯坦世界体系理论 examines an interdependent economy through core 核心, periphery 边缘 and semi-periphery 半边缘 roles. Core activities commonly have greater capital, high-value production and influence; peripheral activities are often more dependent on lower-value production. Semiperipheral places combine features. These are relational categories, not permanent labels establishing identical conditions for all residents.
A dependency 依附 perspective emphasises how unequal external relationships can constrain development. Commodity dependence exposes exporters to concentrated demand and price changes. Trade alone does not prove exploitation or that improvement is impossible.
Original theory task. A fictional economy invests in transport and factories but relies heavily on one foreign commodity buyer. Rostow directs attention to investment and industrial change; dependency/world-systems approaches examine external bargaining and value flows. Compare what each explains and what evidence is missing, rather than declaring one model universally true.
Vocabulary
Train
| English |
|---|
| Rostow's stages of growth/ˈrɒstəʊz ˈsteɪdʒɪz ɒv ɡrəʊθ/ |
| Wallerstein's world-systems theory/ˈwɒləstaɪnz wɜːld ˈsɪstəmz ˈθɪəri/ |
| core/kɔː/ |
| periphery/pəˈrɪfəri/ |
| semi-periphery/ˈsemi pəˈrɪfəri/ |
| dependency/dɪˈpendənsi/ |
7.6 7.7
Trade and the World Economy
Syllabus
| Enduring Understanding | Learning Objective | Essential Knowledge |
|---|---|---|
PSO-7 | PSO-7.A |
|
| Enduring Understanding | Learning Objective | Essential Knowledge |
|---|---|---|
PSO-7 | PSO-7.A |
|
Source: College Board AP Course and Exam Description
Comparative advantage 比较优势 means lower opportunity cost 机会成本: producing a good requires giving up less of another good than a trading partner does. It differs from absolute advantage, which concerns greater output from the same resources. Complementarity 互补性 links one place's supply with another's demand; costs, infrastructure and policies also affect trade.
Original opportunity-cost task. In one day, A can make either 10 grain units or 5 cloth units; B can make either 6 grain or 4 cloth. Assume constant trade-offs. A has absolute advantage in both outputs. For one grain, A gives up $5/10=0.5$ cloth while B gives up $4/6\approx0.67$ cloth, so A has comparative advantage in grain. For one cloth, A gives up $10/5=2$ grain and B gives up $6/4=1.5$ grain, so B has comparative advantage in cloth. A trade rate between 1.5 and 2 grain per cloth can offer gains before transport and adjustment costs. Gains need not be shared equally among people.
Tariffs 关税 tax imports and can alter prices and firm locations. Free-trade agreements reduce specified barriers; they do not remove every rule or give every bloc identical external tariffs. The WTO, EU, Mercosur and OPEC have different memberships and functions: a trade-rule organisation, integration arrangements and a petroleum-producer organisation are not the same institution. Neoliberal policies favour market liberalisation, privatisation and reduced barriers; their effects depend on context. Debt crises and international lending, including IMF programmes, show financial interdependence and can affect public spending and policy choices.
Outsourcing 外包 contracts tasks to another organisation; offshoring moves activities abroad. Either can occur without the other. Special economic zones 经济特区 offer distinctive rules or incentives to attract activity; free-trade and export-processing zones have related but varying arrangements. New manufacturing can create jobs while pay, skills, labour conditions and local linkages determine who benefits.
Post-Fordist production uses more flexible organisation; just-in-time delivery reduces inventories but can increase disruption exposure. Economies of scale spread some fixed costs over output. Agglomeration and growth poles concentrate linked activity, while multiplier effects arise as spending supports other local businesses; imports and saving can reduce local circulation. Deindustrialisation 去工业化 can reflect relocation, productivity changes or restructuring, not a complete end to manufacturing.
Vocabulary
Train
| English |
|---|
| Comparative advantage/kəmˈpærətɪv ədˈvæntɪdʒ/ |
| Outsourcing/aʊtˈsɔːsɪŋ/ |
| Special economic zones/ˈspeʃl ˌiːkəˈnɒmɪk zəʊnz/ |
| Complementarity/ˌkɒmplɪmənˈtærɪti/ |
| Tariffs/ˈtærɪfs/ |
| opportunity cost/ɒpəˈtjuːnɪti kɒst/ |
| Deindustrialisation/ˌdeɪndəˌstrɪəlaɪˈzeɪʃn/ |
7.8
Sustainable Development

Syllabus
| Enduring Understanding | Learning Objective | Essential Knowledge |
|---|---|---|
IMP-7 | IMP-7.A |
|
Source: College Board AP Course and Exam Description
Sustainable development 可持续发展 meets present needs without compromising future generations' ability to meet theirs. Economic, social and environmental effects must be assessed together; rising output alone is insufficient. Resource depletion, mass consumption, pollution and climate change can impose costs across places and generations.
Ecotourism 生态旅游 can fund conservation and local jobs in natural environments, but visitor pressure, resource use and profit leakage can limit benefits. Small-scale renewable energy and public transport can support development, depending on access, costs, maintenance and environmental effects. The UN's Sustainable Development Goals (SDGs) 可持续发展目标 provide shared goals and indicators; a project label does not establish progress on every goal.
An ecological footprint 生态足迹 estimates demand on biologically productive area under a defined method. It is not a measure of every environmental harm. Evaluate the measure's scope and data.
Original project task. A reserve receives more tourists and creates guide jobs, but water use and waste rise and outside firms retain most hotel income. Explain one benefit and two limits. Investigate local earnings, conservation spending, water supply and waste management before concluding that the project is sustainable.
Vocabulary
Train
| English |
|---|
| Sustainable development/səˈsteɪnəbl dɪˈveləpmənt/ |
| Ecotourism/ˈekətʊərɪzəm/ |
| Sustainable Development Goals (SDGs)/səˈsteɪnəbl dɪˈveləpmənt ɡəʊlz/ |
| ecological footprint/ˌekəˈlɒdʒɪkl ˈfʊtprɪnt/ |
7.8
Exam tips
Identify the activity or measure precisely. Read denominators and distinguish averages from distribution. Compare opportunity costs rather than absolute output. Apply models with assumptions and limits. Connect economic changes to specific people and places; do not infer all outcomes from a photograph, sector share or project label.
Interactive lessons on this topic
Work through it step by step, with instant-check exercises.