Scope and prerequisites
ACT framework, February 2026 revision. Original classroom cases are not an official form; preserve the scored/field-test boundaries of each source form.
- Read values with correct axes, units and conditions
- Translate a table into a trend and interpolate within a measured interval
- Evaluate an extrapolation 外推 against the model’s assumptions
Prerequisites: Tables; units; slopes; interpolation 插值 versus extrapolation.
Explain and choose the method
Data Representation passages use tables, graphs or diagrams as primary evidence 证据. Start with the variable labels and units, and identify which conditions are held constant. A row may report one trial or an average; a legend may distinguish groups measured under different conditions. Locate the requested value before using prior scientific knowledge.
Translate representations without changing their meaning. A rising quantity can have a falling rate 速率 of increase. A steep line is meaningful only relative to axis scales and units. When comparing curves, distinguish an absolute value, a difference and a rate. Use corresponding x-values for a fair comparison unless the stem explicitly asks for another relationship.
Interpolation estimates inside observed bounds. For a straight segment between two points, use the fraction of the input interval and apply it to the output difference. Extrapolation extends beyond those bounds and depends more strongly on the proposed model. Negative predicted quantities or physical limits supplied by the passage can reveal a model’s invalid extension.
Reevaluation asks whether new evidence supports an earlier trend or requires a different explanation. One discordant measurement could reflect noise or a model limitation; use the stated uncertainty and experimental conditions. The dataset here is original and hypothetical, so the task’s given model supplies the relevant relationships. It is not a claim about every real material.
A rate of change 变化率 compares output change with the matching input interval. $r=\Delta T/\Delta t=(32-28)\,{}^\circ\mathrm C/(4-2)\,\mathrm{min}=2\,{}^\circ\mathrm C/\mathrm{min}$. A rising temperature can have a falling rate. Read units before calculating.
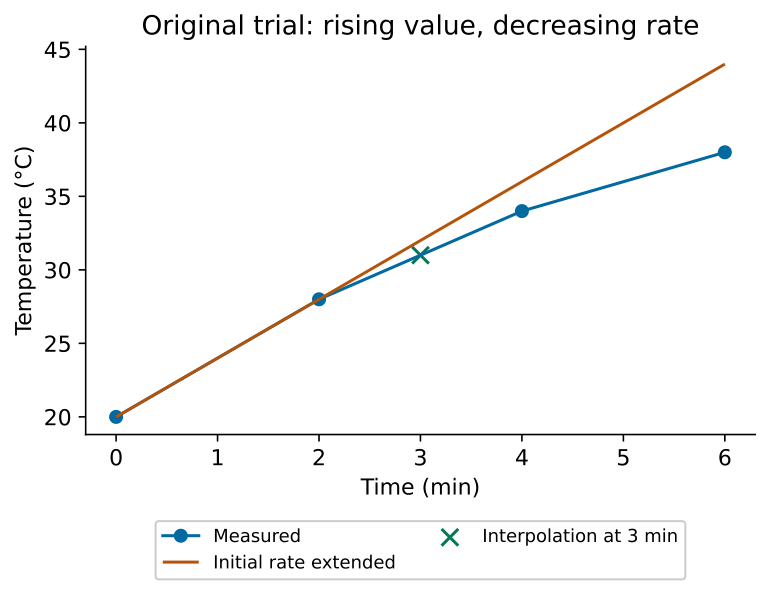
Existing worked example: Original trial: identical containers hold a test liquid, starting at 20°C in the same room. Recorded times in minutes are 0, 2, 4, 6; measured temperatures in °C are 20, 28, 34, 38. The liquid warms, but consecutive two-minute rises are 8, 6 and 4°C: its average warming rate decreases. Linear interpolation between 2 and 4 minutes gives T(3)=28+(3−2)/(4−2)×(34−28)=31°C. Extending the first interval’s 4°C/min rate to 6 minutes predicts 44°C, inconsistent with the measured 38°C. New evidence therefore rejects a constant-rate model across all six minutes.
Complete original context
Original hypothetical research summary — A cooling sleeve
A laboratory team tests sleeves intended to reduce a small sensor's temperature during operation. All sensors start at 22°C. Temperature is measured after ten minutes of use with the same power setting, room conditions and measuring instrument. Sleeve A costs 4 units, B costs 7 units, and an unsleeved sensor is the control. The design brief requires a cost no greater than 5 units and a final temperature no greater than 35°C. Lower temperature alone is not the only design criterion.
Experiment 1 uses identical sensors and records three independent trials per sleeve. Final temperatures in °C are: control 41,42,43; A 33,34,35; B 30,31,32. The team resets the starting temperature and checks the sensor charge before each trial. They report the means and the full observed ranges. The ranges describe these trials, not every future result. The team has not yet measured sleeve durability.
Experiment 2 investigates thickness for material A. Each sleeve has the same length and fit; thicknesses are 1,2,3 mm. Mean final temperatures are 38,34,32°C respectively. All other stated conditions match Experiment 1. Changing thickness also changes material quantity, so a future design review must measure costs instead of assuming they stay at 4 units. A student proposes testing a 3-mm sleeve in material B against a 1-mm sleeve in material A to identify thickness's effect. This comparison would change two factors at once.
Two original models explain the observed temperature pattern. Model P says final temperature depends only on thickness, regardless of material. Model Q says both thickness and material matter; at equal thickness it predicts that material B produces a lower final temperature than A under the same conditions. Both models predict lower final temperatures as thickness rises over the tested 1–3 mm interval. A decreasing trend alone therefore cannot separate them.
Experiment 3 tests new A and B sleeves, each 2 mm thick, in matched conditions. Mean final temperatures are A 34°C and B 31°C. The measuring instrument's stated resolution is 0.1°C, and the team checks its calibration with a reference. Repeated trials would still be needed to characterise variability and rule out other differences in manufacture. The result conflicts with P's material-independence prediction and is consistent with Q's direction; it is not proof that Q is the only possible explanation.
A separate time series for one sensor with sleeve A records temperatures 22,28,32,34°C at 0,2,4,6 minutes. These observations show warming with successively smaller two-minute increases. No measurements beyond six minutes are supplied in this series. A proposal 提案 to continue the first interval's slope to twelve minutes is a model assumption that later measurements may contradict, not a reading from the table.
Independent practice and checked reasoning
Transfer 1
For the separate time series, calculate the three average two-minute warming rates. Describe temperature and rate separately.
Reasoning: $r_1=(28-22)/2=3$, $r_2=(32-28)/2=2$, $r_3=(34-32)/2=1$, all in °C/min. Temperature rises throughout, while these interval-average rates decrease. This does not specify every instantaneous rate.
Transfer 2
Estimate temperature at minute 3 by linear interpolation. Extend the first interval's slope to minute 6 and compare with the actual measurement.
Reasoning: $T(3)=28\,{}^\circ\mathrm C+[(3-2)/(4-2)](32-28)\,{}^\circ\mathrm C=30\,{}^\circ\mathrm C$. First-slope model gives $T(6)=22\,{}^\circ\mathrm C+(3\,{}^\circ\mathrm C/\mathrm{min})(6\,\mathrm{min})=40\,{}^\circ\mathrm C$, above the observed 34°C. Constant early rate is inconsistent with the whole series.
Transfer 3
Is a minute-12 value read from these data or extrapolated? Explain why a graph with a rising curve does not establish indefinite constant-rate warming.
Reasoning: It is extrapolated beyond 0–6 minutes. A rising curve can flatten, and the measured average rates already decline. Predicting minute 12 needs a stated model and additional evidence; temperature direction alone does not fix rate or long-term behaviour.
Limits and next use
A monotonic rise in temperature is not a constant rise per minute. Do not extrapolate an early slope as if later measurements did not exist.
All tasks here are public original practice with authored guidance. They are not official questions or fresh diagnostics. Existing protected tests and mocks remain separate.