Inference using normal and t-distributions
| English | Chinese | Pinyin |
|---|---|---|
| sample | 样本 | yàng běn |
| distribution | 分布 | fēn bù |
| variance | 方差 | fāng chà |
| tail | 尾部 | wěi bù |
| confidence interval | 置信区间 | zhì xìn qū jiān |
| degrees of freedom | 自由度 | zì yóu dù |
| standard error | 标准误 | biāo zhǔn wù |
| paired | 配对 | pèi duì |
| pooled estimate | 合并估计 | hé bìng gū jì |
Small samples 样本, honest uncertainty
- With a huge sample you can use the normal distribution 分布. But with only, say, 8 measurements and an unknown spread, the normal is too confident.
- William Gosset, brewing at Guinness, invented the $t$-distribution to handle exactly this — small samples with unknown variance 方差.
When to use the t-distribution
- Use the $t$-distribution when the sample is small and the population variance is unknown (you estimate it with the sample's $s$).
- It is bell-shaped like the normal but with heavier tails 尾部 — wider, to admit the extra uncertainty.
The t-distribution is bell-shaped like the normal but with heavier tails; as the sample grows it approaches the normal.
Inference & the normal curve
P(Z < z)
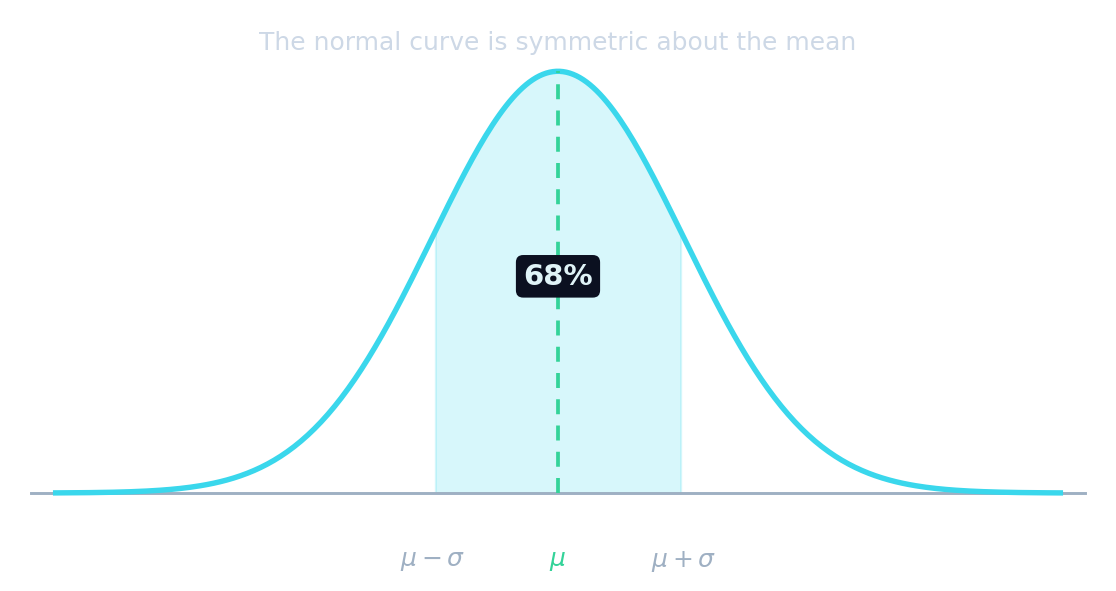
Tests and intervals read areas under the normal curve — slide z to find them.
You use the t-distribution (rather than the normal) when:
Small n with unknown σ → estimate with s and use t.
The t-distribution has heavier tails than the normal distribution.
Heavier tails reflect the extra uncertainty from estimating the variance; t → normal as n grows.
Confidence interval 置信区间 for the mean
- A confidence interval for the population mean:
- $t$ comes from the $t$-tables with $n - 1$ degrees of freedom 自由度; $\dfrac{s}{\sqrt n}$ is the standard error 标准误.
For a single sample of size n = 10, how many degrees of freedom does the t-value use?
Degrees of freedom = n − 1 = 9.
The quantity s/√n is called the standard ______.
The standard error of the mean is s/√n.
Worked example
- A sample of $n = 10$ has $s = 4$; for 95% with 9 degrees of freedom, $t = 2.262$.
- Margin $= t\dfrac{s}{\sqrt n} = 2.262 \times \dfrac{4}{\sqrt{10}} = 2.86$ (2 dp).

The t-distribution has a lower peak and heavier tails than the normal
A sample n = 10 has s = 4. With t = 2.262, what is the margin t × s/√n? (2 dp)
2.262 × 4/√10 = 2.262 × 1.265 = 2.86.
Comparing two populations
- A 2-sample or paired 配对 $t$-test compares two populations.
- When the two are assumed to share a variance, combine them into a pooled estimate 合并估计 of $s^2$.
Degrees of freedom, not $n$. The $t$-value uses $n - 1$ degrees of freedom, not $n$. Reading the wrong row of the table is the most common error.
- For a small sample, base a hypothesis test on the $t$-distribution: a 2-sample t-test or a paired sample t-test.
You've got it
- small sample + unknown variance → use the $t$-distribution ($n-1$ degrees of freedom)
- CI for the mean: $\bar{x} \pm t\dfrac{s}{\sqrt{n}}$, with standard error $\dfrac{s}{\sqrt n}$
- compare two populations with a 2-sample or paired $t$-test (pool the variance when shared)